
CPU Benchmarks and Hierarchy 2023: Processor Ranking Charts
Our CPU benchmarks performance hierarchy ranks current and previous-gen Intel and AMD processors based on performance, including all of the Best CPUs for Gaming. Below the CPU ranking charts and tables, this guide also gives you a basic introduction to CPU benchmarking and includes a list of commonly-used CPU benchmark utilities.
Your CPU greatly affects overall performance and is considered a computer’s most important component. CPU benchmark comparisons help us sort out the differences between chips, but when it comes time to buy a CPU for your desktop, you’ll find a dizzying collection of model numbers and specs from both Intel and AMD.
We’ve listed the best CPUs for gaming and best CPUs for workstations in other articles, but if you want to know how each chip stacks up against all the others and how we come to our decisions, this CPU benchmarks hierarchy is for you. If you’re looking for a broader view of the current state of the market, head to our AMD vs Intel feature for more CPU comparisons.
We recently tested AMD’s value-centric lineup of “Non-X” Ryzen 7000 65W processors in our AMD Ryzen 9 7900, Ryzen 7 7700, and Ryzen 5 7600 Review: Zen 4 Gets More Affordable article. These chips lower the entry-level pricing to AMD’s potent AM5 ecosystem drastically, but Intel’s Raptor Lake still holds the advantage in most of the key price bands. That might change in the middle of next month when AMD’s new lineup of three Ryzen 7000X3D processors land with the company’s revolutionary 3D V-Cache technology.
We also have plenty of testing with the first Raptor Lake chips, which come in the form of the Core i9-13900K, Core i7-13700K, and Core i5-13600K. These chips are game-changers, upsetting AMD’s product stack and offering a better value at every price point. Intel also announced its 65W locked Raptor Lake processors at CES 2023 and we have several models in the lab now, including the 6 GHz Core i9-13900KS and Core i5-13400, so keep your eyes peeled for new reviews and Intel CPU benchmarks.
AMD’s full-powered Ryzen 7000 processors are impressive. We reviewed the Ryzen 9 7950X and Ryzen 5 7600X and have added those chips to the CPU benchmark rankings below. We’ve also added the Ryzen 9 7900X and the Ryzen 7 7700X, too.
On the other end of the spectrum, we have AMD’s fire-breathing 64-core 128-thread Threadripper Pro 5995WX in the charts, along with the 32-core 64-thread Threadripper Pro 5975WX and 3975WX. These chips provide surprisingly strong performance in gaming, but they’re geared specifically for the workstation market. Intel has announced that its new Fishhawk Falls workstation processors, which are rumored to have HEDT models, too, are headed to market next month. As such, we’ll have plenty of new workstation CPU benchmarks to add to these charts in the coming weeks.
We’ll explain how we ranked the processors under each table. The game testing ranking is first. We also include a productivity application performance metric, which we’ve split up into single- and multi-threaded measurements. We also have an integrated graphics CPU gaming benchmark ranking so you can see how AMD’s APUs stack up to Intel’s processors.
CPU Benchmarks Rankings 2023 – Windows 10 and Windows 11


We have two sets of benchmarks in the album above. Our step up to a new RTX 4090 has re-ordered our hierarchy quite a bit, so we have made a clean break for our rankings. All of our Windows 11 tests above were conducted with the Nvidia GeForce RTX 4090, and we’ll build out all future test results with this platform.
We rank all the Intel and AMD processors using the Windows 11 and RTX 4090 test bench in the tables below, but we don’t include CPU overclock performance rankings. You can see all of those numbers in the charts above. We’ve also added separate charts for integrated graphics testing below.
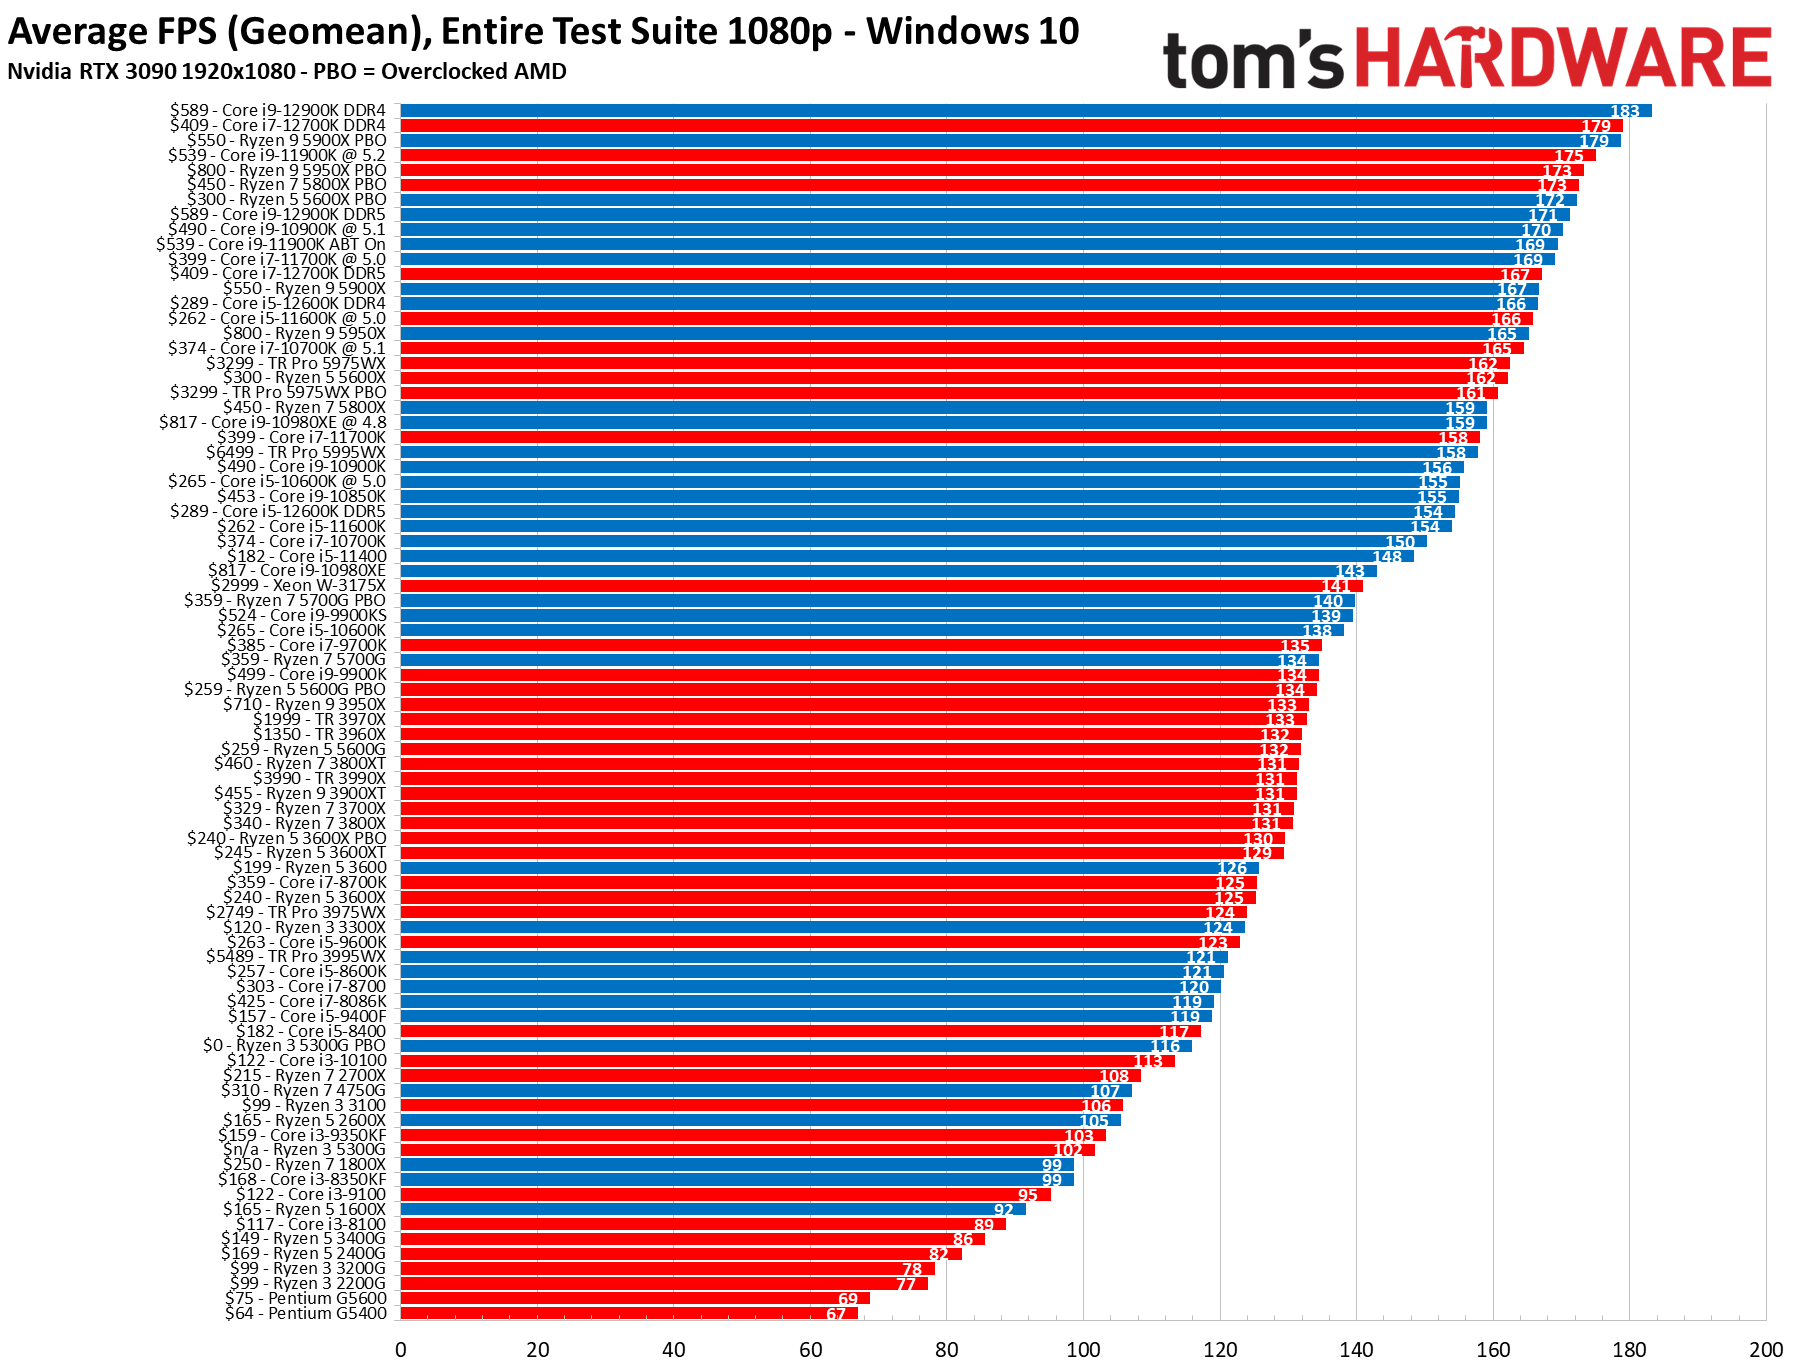
Because we have a much broader selection of test results with our now-legacy Windows 10 and RTX 3090 platform, we’ve also included slides with those results in the above album. You can also find those results in table form in our legacy section at the end of the article.
Bear in mind that the charts above use the raw performance numbers, whereas our CPU benchmarks rankings in the tables below use a score to rank the chips relative to one another. Admittedly, the charts are getting a bit packed as we expand our rankings pool, but we’ll work to separate this into different classes as our CPU benchmarks database grows.
Gaming CPU Benchmarks Ranking 2023
| 1080p Gaming Score | 1440p Gaming Score | Architecture | Cores/Threads (P+E) | Base/Boost GHz | TDP – MTP | Buy | |
|---|---|---|---|---|---|---|---|
| $589 – Core i9-13900K | 100.00% | 100.00% | Raptor Lake | 24 / 32 (8+16) | 3.0 / 5.8 | 125 / 253W | |
| $409 – Core i7-13700K | 96.09% | 97.09% | Raptor Lake | 16 / 24 (8+8) | 3.4 / 5.4 | 125 / 253W | |
| $365 – Ryzen 7 5800X3D | 94.42% | 97.45% | Zen 3 | 8 / 16 | 3.4 / 4.5 | 105W | |
| $319 – Core i5-13600K | 90.03% | 92.94% | Raptor Lake | 14 / 20 (6+8) | 3.5 / 5.1 | 125 / 181W | |
| $474 – Ryzen 9 7900X | 87.40% | 90.52% | Zen 4 | 12 / 24 | 4.7 / 5.6 | 170 / 230W | |
| $569 – Ryzen 9 7950X | 87.25% | 90.27% | Zen 4 | 16 / 32 | 4.5 / 5.7 | 170 / 230W | |
| $349 – Ryzen 7 7700X | 87.13% | 91.55% | Zen 4 | 8 /16 | 4.5 / 5.4 | 105 / 142W | |
| $329 – Ryzen 7 7700 | 86.19% | 88.88% | Zen 4 | 8 / 16 | 3.8 / 5.3 | 65 / 88W | |
| $429 – Ryzen 9 7900 | 84.75% | 88.46% | Zen 4 | 12 / 24 | 4.7 / 5.6 | 170 / 230W | |
| $249 – Ryzen 5 7600X | 83.62% | 88.44% | Zen 4 | 6 / 12 | 4.7 / 5.3 | 105 / 142W | |
| $229 – Ryzen 5 7600 | 79.74% | 85.97% | Zen 4 | 6 / 12 | 3.8 / 5.1 | 65 / 88W | |
| $550 – Ryzen 9 5950X | 72.04% | 77.51% | Zen 3 | 16 / 32 | 3.4 / 4.9 | 105W | |
| $350 – Ryzen 9 5900X | 71.69% | 78.95% | Zen 3 | 12 / 24 | 3.7 / 4.8 | 105W | |
| $235 – Ryzen 7 5800X | 70.90% | 78.19% | Zen 3 | 8 / 16 | 3.8 / 4.7 | 105W | |
| $210 – Ryzen 7 5700X | 69.50% | 76.65% | Zen 3 | 8 / 16 | 3.4 / 4.6 | 65W | |
| $165 – Ryzen 5 5600X | 67.52% | 74.68% | Zen 3 | 6 / 12 | 3.7 / 4.6 | 65W | |
| $189 – Core i5-12400 | 66.62% | 73.53% | Alder Lake | 6 / 12 (6+0) | 2.5 / 4.4 | 65 / 117W |
We have two rankings for each chip, based on 1080p and 1440p CPU gaming benchmarks. We conducted these tests in Windows 11. The most powerful chip gets a 100, and all others are scored relative to it. We tested all platforms that support DDR5 with the newer memory — in general, Intel’s chips lose a few percentage points of performance with DDR4 memory (more testing here). We also have DDR4 vs DDR5 testing in our legacy testing further below.
The chart is aligned in order based on the 1080p game results, but the 1440p listings aren’t listed in sequential order due to unfortunate limitations with our tables. So pay attention to the 1440p rankings: Some faster chips at 1440p CPU benchmarks may be listed below slower chips due to the 1080p results.
We’re working to expand this roster of gaming CPU benchmarks quickly, with the 12th-Gen Alder Lake chips on our test bench now. We will test back to the seventh-gen Intel and the AMD Bulldozer chips over the next few months, so keep an eye out for our updates. For now, head to our legacy section below for all Pre- 12th-Gen and Zen 3 benchmarks.
We measured performance for the 1080p CPU gaming benchmarks with a geometric mean of Cyberpunk 2077, Hitman 3, Far Cry 6, F1 2021, Microsoft Flight Simulator 2021, Red Dead Redemption 2, Warhammer 3, and Watch Dogs Legion. Not all games scale well moving from 1080p to 1440p, so we measured performance for the 1440p CPU gaming benchmarks with a geometric mean of Far Cry 6, F1 2021, Microsoft Flight Simulator 2021, Red Dead Redemption 2, Warhammer 3 and Watch Dogs Legion.
Integrated GPU Gaming CPU Benchmarks Rankings 2023


| 1280×720 | 1920×1080 | |
| Ryzen 7 5700G B550-E | 100% | 100% |
| Ryzen 5 5600G | 96.3% | 96% |
| Ryzen 7 4750G | 92.9% | 94.1% |
| Ryzen 3 5300G | 85.8% | 87.2% |
| Ryzen 5 3400G | 83.5% | 84.1% |
| Ryzen 3 3200G | 77.1% | 78.1% |
| Intel UHD Graphics 750 32 EU (11600K, 11700K) | 58.3% | ~48.9% |
| Intel UHD Graphics 730 24 EU (i5-11400) | 51.7% | 42.9% |
| Intel UHD Graphics 630 24 EU (10600K) | 36.0% | 34.4% |
Here’s our list of gaming performance with integrated graphics on several of the leading APUs available. We’ve split this into two different price ranges, so be sure to flip through all of the performance charts. For a bit of commentary and analysis of these results, head to our Ryzen 7 5700G, Ryzen 5 5600G, and Ryzen 3 5300G reviews. The most powerful chip gets a 100, and all others are scored relative to it.
Single-Threaded CPU Benchmarks Rankings 2023
| Single-Threaded App Score | Architecture | Cores/Threads (P+E) | Base/Boost GHz | TDP – MTP | |
|---|---|---|---|---|---|
| $589 – Core i9-13900K | 100.00% | Raptor Lake | 24 / 32 (8+16) | 3.0 / 5.8 | 125 / 253W |
| $409 – Core i7-13700K | 92.65% | Raptor Lake | 16 / 24 (8+8) | 3.4 / 5.4 | 125 / 253W |
| $569 – Ryzen 9 7950X | 89.66% | Zen 4 | 16 / 32 | 4.5 / 5.7 | 170 / 230W |
| $589 – Core i9-12900K | 89.27% | Alder Lake | 16 / 24 (8+8) | 3.2 / 5.2 | 125 / 241W |
| $474 – Ryzen 9 7900X | 88.49% | Zen 4 | 12 / 24 | 4.7 / 5.6 | 170 / 230W |
| $319 – Core i5-13600K | 88.41% | Raptor Lake | 14 / 20 (6+8) | 3.5 / 5.1 | 125 / 181W |
| $349 – Ryzen 7 7700X | 87.55% | Zen 4 | 8 /16 | 4.5 / 5.4 | 105 / 142W |
| $409 – Core i7-12700K | 86.07% | Alder Lake | 12 / 20 (8+4) | 3.6 / 5.0 | 125 / 190W |
| $429 – Ryzen 9 7900 | 85.81% | Zen 4 | 12 / 24 | 4.7 / 5.6 | 170 / 230W |
| $249 – Ryzen 5 7600X | 85.78% | Zen 4 | 6 / 12 | 4.7 / 5.3 | 105 / 142W |
| $289 – Core i5-12600K | 84.72% | Alder Lake | 10 / 16 (6+4) | 3.7 / 4.9 | 125 / 150W |
| $329 – Ryzen 7 7700 | 83.62% | Zen 4 | 8 / 16 | 3.8 / 5.3 | 65 / 88W |
| $229 – Ryzen 5 7600 | 80.06% | Zen 4 | 6 / 12 | 3.8 / 5.1 | 65 / 88W |
| $189 – Core i5-12400 | 75.70% | Alder Lake | 6 / 12 (6+0) | 2.5 / 4.4 | 65 / 117W |
| $550 – Ryzen 9 5950X | 73.73% | Zen 3 | 16 / 32 | 3.4 / 4.9 | 105W |
| $350 – Ryzen 9 5900X | 72.88% | Zen 3 | 12 / 24 | 3.7 / 4.8 | 105W |
| $210 – Ryzen 7 5700X | 69.12% | Zen 3 | 8 / 16 | 3.4 / 4.6 | 65W |
| $165 – Ryzen 5 5600X | 68.66% | Zen 3 | 6 / 12 | 3.7 / 4.6 | 65W |
| $365 – Ryzen 7 5800X3D | 67.18% | Zen 3 | 8 / 16 | 3.4 / 4.5 | 105W |
We calculate the above single-threaded CPU benchmarks rankings based on a geometric mean of the Cinebench, POV-Ray, and LAME CPU benchmarks. The most powerful chip gets a 100, and all others are scored relative to it.
Single-threaded performance is often tied directly to the responsiveness and snappiness of your PC in any number of daily applications, like loading an operating system or surfing the web. This metric largely depends upon a mixture of instruction per cycle (IPC) throughput (the number of operations the chip can execute in one clock cycle) and frequency, which is the speed at which the transistors switch between on and off states.
However, a whole host of other considerations, such as cache, architecture, and interconnects (like rings, meshes, and infinity fabric) impact this measure of per-core performance, so these results do not align perfectly based on clock frequency. Instead, performance varies with each application and how well it is tuned for the respective architectures.
Multi-Threaded CPU Benchmarks Rankings 2023
| Multi-Threaded App Score | Architecture | Cores/Threads (P+E) | Base/Boost GHz | TDP – MTP | |
|---|---|---|---|---|---|
| $569 – Ryzen 9 7950X | 100.00% | Zen 4 | 16 / 32 | 4.5 / 5.7 | 170 / 230W |
| $589 – Core i9-13900K | 98.62% | Raptor Lake | 24 / 32 (8+16) | 3.0 / 5.8 | 125 / 253W |
| $474 – Ryzen 9 7900X | 79.51% | Zen 4 | 12 / 24 | 4.7 / 5.6 | 170 / 230W |
| $409 – Core i7-13700K | 79.05% | Raptor Lake | 16 / 24 (8+8) | 3.4 / 5.4 | 125 / 253W |
| $429 – Ryzen 9 7900 | 69.97% | Zen 4 | 12 / 24 | 4.7 / 5.6 | 170 / 230W |
| $589 – Core i9-12900K | 69.85% | Alder Lake | 16 / 24 (8+8) | 3.2 / 5.2 | 125 / 241W |
| $550 – Ryzen 9 5950X | 67.30% | Zen 3 | 16 / 32 | 3.4 / 4.9 | 105W |
| $319 – Core i5-13600K | 60.91% | Raptor Lake | 14 / 20 (6+8) | 3.5 / 5.1 | 125 / 181W |
| $409 – Core i7-12700K | 59.62% | Alder Lake | 12 / 20 (8+4) | 3.6 / 5.0 | 125 / 190W |
| $350 – Ryzen 9 5900X | 58.02% | Zen 3 | 12 / 24 | 3.7 / 4.8 | 105W |
| $349 – Ryzen 7 7700X | 56.15% | Zen 4 | 8 /16 | 4.5 / 5.4 | 105 / 142W |
| $329 – Ryzen 7 7700 | 52.87% | Zen 4 | 8 / 16 | 3.8 / 5.3 | 65 / 88W |
| $289 – Core i5-12600K | 45.69% | Alder Lake | 10 / 16 (6+4) | 3.7 / 4.9 | 125 / 150W |
| $249 – Ryzen 5 7600X | 43.89% | Zen 4 | 6 / 12 | 4.7 / 5.3 | 105 / 142W |
| $365 – Ryzen 7 5800X3D | 41.54% | Zen 3 | 8 / 16 | 3.4 / 4.5 | 105W |
| $229 – Ryzen 5 7600 | 40.61% | Zen 4 | 6 / 12 | 3.8 / 5.1 | 65 / 88W |
| $210 – Ryzen 7 5700X | 39.77% | Zen 3 | 8 / 16 | 3.4 / 4.6 | 65W |
| $189 – Core i5-12400 | 33.68% | Alder Lake | 6 / 12 (6+0) | 2.5 / 4.4 | 65 / 117W |
| $165 – Ryzen 5 5600X | 32.47% | Zen 3 | 6 / 12 | 3.7 / 4.6 | 65W |
The multi-threaded workload column is based on CPU benchmarks performance in Cinebench, POV-ray, vray, Blender (four tests – Koro, Barcellona, Classroom, bmw27), y-cruncher, and Handbrake x264 and x265 workloads. These CPU benchmarks represent performance in productivity-focused applications that tend to require more compute horsepower. The most powerful chip gets a 100, and all others are scored relative to it.
Like we see with single-threaded performance metrics, multi-threaded performance, which measures a chip’s performance in applications that utilize multiple software threads, varies based on a whole host of architectural factors. It also depends heavily upon how well the software scales with additional compute cores. As such, these results do not align perfectly based on core/thread count, though it does serve as a decent litmus of multi-threaded performance.
Be aware that architectures, caches, and interconnects profoundly impact these results, as all of these factors impact how well performance scales with additional threads. Performance rarely scales perfectly with the addition of more cores/threads, so the scaling factor of each processor architecture weighs heavily on the value proposition of going with a higher core count processor.
How to Benchmark your CPU
Benchmarking your CPU is an essential practice for CPU overclocking, or if you’re merely tuning your system. Simply run a CPU benchmark before you make any changes, then re-test after changes to see the results. You can head to our deep-dive details of overclocking in our How to Overclock a CPU guide for more details on tuning your processor, but if you want to learn how to benchmark your CPU, you’re in the right place.
How do you benchmark your CPU? Well, that’s not as complicated as you might think. Choosing the best CPU benchmarks can be a daunting task, but the general rule is that the best performance benchmark is simply measuring the performance of the programs you use the most. However, you might not be able to find other benchmarks to compare to, so these real-world benchmarks might not help you compare your performance to other CPUs.
However, if the programs you frequently use don’t have built-in benchmarks you can also use similar types of programs (renderers or encoders, for instance) as a proxy for your workload. There are also several well-known benchmarks with large databases that enable easy comparisons. You can also compare your results to the benchmarks you see in our library of reviews to get a good sense of how your system stacks up. We have a list of some great productivity benchmarks, and their download links, below.
These same theories apply to CPU game benchmarking — the best CPU benchmark is the game that you play the most. You can download an fps counter, like FRAPS, to measure performance during your gaming session. Games can vary widely, so we don’t have a specific list of titles to test. However, you can use the gaming CPU benchmarks you see in our reviews as a good starting point.
You can also use synthetic gaming CPU benchmarks, a few of which we have listed below. Just be aware that these synthetic CPU benchmarks don’t tend to translate well to real-world gaming, but they do show us the raw amount of compute power exposed to game engines. However, given their stability and repeatability, these are great benchmarks for comparing performance before and after any changes you may make to your system.
Most often overlook web-browser performance, but these are among the best CPU benchmarks to measure performance in single-threaded workloads, which helps quantify the snappiness in your system. This also often directly correlates to performance in games that prize single-threaded performance. We’ve included a few web browser benchmarks below as well.
If you plan to compare to other gaming and application CPU benchmark results from reviews, forums, or friends, be sure to turn off as many background tasks as possible during your benchmarks to eliminate that influence from your CPU benchmark results. Here’s a list with download links for some of the most common CPU benchmarks:
Best CPU Benchmarks You Can Run
- Cinebench R23 (MS Store (opens in new tab)) — This rendering CPU benchmark program has both single- and multi-core benchmark modes. This is one of the most commonly-used CPU benchmarks.
- UL Benchmarks 3DMark — This synthetic CPU benchmark has a plethora of built-in tests for both CPUs and GPUs and is updated regularly with new tests. This is the go-to synthetic gaming test for many.
- CPU-Z — This is a common utility that exposes the details of your processor, but it also has a built-in CPU benchmark that is incredibly simple to run. The single- and multi-thread test results don’t correlate well to real-world tasks, but the tests’ stability makes them well suited for before and after comparisons. CPU-Z test results are also widely shared among enthusiasts, so it’s easy to find comparison systems.
- POV-Ray — This rendering CPU benchmark has both single- and multi-threaded test options but uses a heavier distribution of AVX instructions than Cinebench to create a taxing CPU benchmark.
- C-Ray — This CPU benchmark uses a raytracer rendering engine to measure a CPU’s multi-threaded performance in floating-point operations.
- HandBrake — The HandBrake encoder comes with a plethora of options, so you can easily tailor the encoding CPU benchmark to your needs. Simply measure the amount of time it takes to encode a video, and then use that as your baseline for comparison.
- Corona — This is another popular rendering utility and is a simple-one click CPU benchmark that uses the Chaos Corona render engine to measure CPU performance in multi-threaded workloads.
- WebXPRT 4 — This is a click-to-run CPU benchmark that runs in your browser to measure performance in HTML5, JavaScript, and WebAssembly-based tests. This is a great CPU benchmark to measure single-threaded performance.
- ARES-6 — This is a click-to-run CPU benchmark that runs in your browser to measure performance in JavaScript but has a heavy weighting towards the neural network (machine learning) workloads that are becoming increasingly common. This is a great CPU benchmark to measure single-threaded performance.
- y-cruncher — This CPU benchmark runs from a command line, so it isn’t the most user-friendly. However, it calculates Pi using the latest AVX instruction sets in a heavily-threaded manner, making it among the best to measure SIMD performance. Beware, this test can break overclocks easily (which also means it is great for stress testing).
2023 CPU Benchmarks Test System and Configuration
| Intel Socket 1700 DDR5 (Z790) | Core i9-13900K, i7-13700K, i5-13600K |
| MSI MPG Z790 Carbon WiFi | |
| G.Skill Trident Z5 RGB DDR5-6800 – Stock: DDR5-5600 | OC: XMP DDR5-6800 | |
| AMD Socket AM5 (X670E) | Ryzen 9 7900, Ryzen 7 7600, Ryzen 5 7600, Ryzen 9 7950X, Ryzen 9 7900X, Ryzen 5 7600X |
| ASRock X670E Taichi | |
| G.Skill Trident Z5 Neo DDR5-6000 – Stock: DDR5-5200 | OC/PBO: DDR5-6000 | |
| Intel Socket 1700 DDR5 (Z690) | Core i5-12400, i5-12600K, i7-12700K, i9-12900K |
| MSI MEG Z690 Ace | |
| G.Skill Trident Z5 DDR5-6400 – Stock: DDR5-4400 | OC DDR5-6000 | |
| AMD Socket AM4 (X570) | Ryzen 9 5950X, 5900X, 5700X, 5600X, 5800X3D |
| MSI MEG X570 Godlike | |
| 2x 8GB Trident Z Royal DDR4-3600 – Stock: DDR4-3200 | OC/PBO: DDR4-3800 | |
| All Systems | Asus RTX 4090 ROG Strix OC |
| Gigabyte GeForce RTX 3090 Eagle – ProViz applications | |
| Nvidia GeForce RTX 2080 Ti FE – Application tests | |
| 2TB Sabrent Rocket 4 Plus, Silverstone ST1100-TI, Open Benchtable, Arctic MX-4 TIM, Windows 11 Pro | |
| Cooling | Corsair H115i, Custom loop |
| Overclocking note | All configurations with overclocked memory also have tuned core frequencies and/or lifted power limits. |
Legacy: CPU Benchmarks Rankings 2022 – Windows 10 and 11


Legacy: Gaming CPU Benchmarks Ranking 2022
| 1080p Gaming Score | 1440p Gaming Score | CPU | Cores/Threads | Base/Boost GHz | TDP | Buy | |
|---|---|---|---|---|---|---|---|
| Intel Core i9-12900K DDR4 / DDR5 | 100% / 93.51% | 100% / 95.86% | Alder Lake | 16 / 24 (8P+8E) | 3.2 / 5.2 | 125 / 241W | Core i9-12900K |
| Intel Core i9-11900K | 92.48% | 97.26% | Rocket Lake | 8 / 16 | 3.5 / 5.3 | 125W | Core i9-11900K |
| Intel Core i7-12700K DDR4 / DDR5 | 97.71% / 91.23% | 99.8% / 97.30% | Alder Lake | 12 / 20 (8P+4E) | 3.6 / 4.9 | 125 / 190W | Core i7-12700K |
| AMD Ryzen 9 5900X | 90.98% | 93.18% | Zen 3 | 12 / 24 | 3.7 / 4.8 | 105W | Ryzen 9 5900X |
| Intel Core i5-12600K DDR4 / DDR5 | 90.89% / 84.32% | 96.94% / 92.33% | Alder Lake | 10 / 16 (6P+4E) | 3.7 / 4.9 | 125 / 150W | Core i5-12600K |
| AMD Ryzen 9 5950X | 90.22% | 95.32% | Zen 3 | 16 / 32 | 3.4 / 4.9 | 105W | Ryzen 9 5950X |
| AMD Threadripper Pro 5975WX | 88.71% | 89.71% | Zen 3 | 32 / 64 | 3.6 / 4.5 | 280W | Threadripper Pro 5975WX |
| AMD Ryzen 5 5600X | 88.51% | 91.79% | Zen 3 | 6 / 12 | 3.7 / 4.6 | 65W | Ryzen 5 5600X |
| AMD Ryzen 7 5800X | 86.85% | 91.72% | Zen 3 | 8 / 16 | 3.8 / 4.7 | 105W | Ryzen 7 5800X |
| Intel Core i7-11700K | 86.3% | 92.0% | Rocket Lake | 8 / 16 | 3.6 / 5.0 | 125W | Core i7-11700K |
| AMD Threadripper Pro 5995WX | 86.12% | 84.79% | Zen 3 | 64 / 128 | 2.7 / 4.5 | 280W | Threadripper Pro 5995WX |
| Intel Core i9-10900K | 85.01% | 91.5% | Comet Lake | 10 / 20 | 3.7 / 5.3 | 125W | Core i9-9900K |
| Intel Core i9-10850K | 84.6% | 91.07% | Comet Lake | 10 / 20 | 3.6 / 5.2 | 95W | Core i9-10850K |
| Intel Core i5-11600K | 84.06% | 90.43% | Rocket Lake | 6 / 12 | 3.9 / 4.9 | 125W | Core i5-11600K |
| Intel Core i5-11400 | 80.98% | 87.77% | Rocket Lake | 6 / 12 | 2.6 / 4.4 | 65W | Core i5-11400 |
| Intel Core i7-10700K | 80.66% | 87.88% | Comet Lake | 8 / 16 | 3.8 / 5.1 | 125W | Core i7-10700K |
| Intel Core i9-10980XE | 78.04% | 84.04% | Cascade Lake-X | 18 / 36 | 3.0 / 4.8 | 165W | Core i9-10980XE |
| Intel W-3175X | 76.93% | 82.58% | Skylake | 28 / 56 | 3.1 / 4.3 | 225W | @Newegg |
| Ryzen 7 5700G* | 76.61% | 83.1% | Zen 3 | 8 / 16 | 3.8 / 4.6 | 65W | N/A |
| Intel Core i9-9900KS | 76.12% | 84.85% | Coffee Lake-R | 8 / 16 | 4.0 / 5.0 | 127W | Intel Core i9-9900KS |
| Intel Core i7-10700/F | ~ | ~ | Comet Lake | 8 / 16 | 2.9 / 4.8 | 65W | Intel Core i7-10700 |
| Intel Core i5-10600K | 75.42% | 82.57% | Comet Lake | 6 / 12 | 4.1 / 4.8 | 125W | @Newegg |
| Intel Core i7-9700K | 73.62% | 81.12% | Coffee Lake-R | 8 / 8 | 3.6 / 4.9 | 95W | @Amazon |
| Intel Core i9-9900K / F | 73.41% | 84.85% | Coffee Lake-R | 8 / 16 | 3.6 / 5.0 | 95W | Core i9-9900K |
| AMD Ryzen 9 3950X | 72.63% | 78.58% | Zen 2 | 16 / 32 | 3.5 / 4.7 | 105W | @Amazon |
| AMD Threadripper 3970X | 72.44% | 77.99% | Zen 2 | 32 / 64 | 3.7 / 4.5 | 280W | AMD Threadripper 3970X |
| AMD Threadripper 3960X | 72.07% | 77.12% | Zen 2 | 24 / 48 | 3.8 / 4.5 | 280W | AMD Ryzen Threadripper 3960X |
| AMD Ryzen 5 5600G | 71.99% | 76.76% | Zen 3 | 6 / 12 | 3.9 / 4.4 | 65W | Ryzen 5 5600G |
| AMD Ryzen 7 3800XT | 71.78% | 79.28% | Zen 2 | 8 / 16 | 3.9 / 4.7 | 105W | @Newegg |
| AMD Threadripper 3990X | 71.68% | 77.94% | Zen 2 | 64 / 128 | 2.9 / 4.3 | 280W | AMD Ryzen Threadripper 3990X |
| AMD Ryzen 9 3900XT | 71.67% | 78.55% | Zen 2 | 12 / 24 | 3.8 / 4.7 | 105W | Ryzen 9 3900XT |
| AMD Ryzen 9 3900X | ~ | ~ | Zen 2 | 12 / 24 | 3.8 / 4.6 | 105W | @Amazon |
| Intel Core i9-9980XE | ~ | ~ | Skylake | 18 / 36 | 4.4 / 4.5 | 165W | @B&HPhoto |
| AMD Ryzen 9 3900 | ~ | ~ | Zen 2 | 12 / 24 | 3.1 / 4.3 | 105W | OEM only |
| AMD Ryzen 7 3700X | 71.43% | 79.08% | Zen 2 | 8 / 16 | 3.6 / 4.4 | 65W | Ryzen 7 3700X |
| AMD Ryzen 7 3800X | 71.3% | 78.67% | Zen 2 | 8 / 16 | 3.9 / 4.5 | 105W | Ryzen 7 3800X |
| AMD Ryzen 5 3600XT | 70.62% | 77.75% | Zen 2 | 6 / 12 | 3.8 / 4.5 | 95W | @Newegg |
| AMD Ryzen 5 3600 | 68.63% | 75.59% | Zen 2 | 6 / 12 | 3.6 / 4.2 | 65W | @Amazon |
| Intel Core i9-7960X | ~ | ~ | Skylake | 16 / 32 | 2.8 / 4.2 | 165W | @Newegg |
| Intel Core i7-8700K | 68.47% | 76.41% | Coffee Lake | 6 / 12 | 3.7 / 4.7 | 95W | @Amazon |
| AMD Ryzen 5 3600X | 68.41% | 75.60% | Zen 2 | 6 / 12 | 3.8 / 4.4 | 95W | @Newegg |
| AMD Threadripper Pro 3975WX | 67.63% | 74.42% | Zen 2 | 32 / 64 | 3.5 / 4.2 | 280W | Threadripper Pro 3975WX |
| AMD Ryzen 3 3300X | 67.49% | 74.6% | Zen 2 | 4 / 8 | 3.8 / 4.3 | 65W | @Newegg |
| Intel Core i5-9600K | 67.06% | 75.11% | Coffee Lake-R | 6 / 6 | 3.7 / 4.6 | 95W | @Newegg |
| AMD Threadripper Pro 3995WX | 66.18% | 69.28% | Zen 2 | 64 / 128 | 2.7 / 4.2 | 280W | Threadripper Pro 3995WX |
| Intel Core i5-8600K | 65.84% | 73.4% | Coffee Lake | 6 / 6 | 3.6 / 4.3 | 95W | @Newegg |
| Intel Core i7-8700 | 65.57% | 73.66% | Coffee Lake | 6 / 12 | 3.2 / 4.6 | 65W | Core i7-8700 |
| Intel Core i7-8086K | 65.05% | 73.5% | Coffee Lake | 6 / 12 | 4.0 / 5.0 | 95W | Core i7-8086K |
| Intel Core i5-9400 / i5-9400F | 64.85% | 72.08% | Coffee Lake | 6 / 6 | 2.9 / 4.1 | 65W | @Amazon |
| Intel Core i5-8400 | 63.96% | 71.2% | Coffee Lake | 6 / 6 | 2.8 / 4.0 | 65W | @Newegg |
| AMD Ryzen 5 3500X | ~ | ~ | Zen 2 | 6 / 6 | 3.6 / 4.1 | 65W | @Newegg |
| Core i3-10100 | 61.88% | 69.08% | Comet Lake | 4 / 8 | 3.6 / 4.3 | 65W | Core i3-10100 |
| AMD Ryzen 7 2700X | 59.19% | 66.55% | Zen+ | 8 / 16 | 3.7 / 4.3 | 105W | @Newegg |
| Ryzen 7 4750G* | 58.43% | 66.46% | Zen 2 | 8 / 16 | 3.8 / 4.6 | 65W | Ryzen 7 4750G |
| AMD Ryzen 3 3100 | 57.75% | 64.21% | Zen 2 | 4 / 8 | 3.8 / 3.9 | 65W | @Newegg |
| Intel Core i9-7980XE | ~ | ~ | Skylake | 18 / 36 | 2.6 / 4.2 | 165W | @Amazon |
| Intel Core i9-7900X | ~ | ~ | Skylake | 10 / 20 | 3.3 / 4.3 | 140W | @Newegg |
| AMD Ryzen 5 2600X | 57.55% | 65.33% | Zen+ | 6 / 12 | 3.6 / 4.2 | 95W | @Amazon |
| Intel Core i7-7700K | ~ | ~ | Kaby Lake | 4 / 8 | 4.2 / 4.5 | 91W | @Amazon |
| AMD Threadripper 2990WX (GM) | ~ | ~ | Zen+ | 32 / 64 | 3.0 / 4.2 | 250W | @Newegg |
| Intel Core i7-7820X | ~ | ~ | Skylake | 8 / 16 | 3.6 / 4.3 | 140W | @Amazon |
| AMD Threadripper 2950X (GM) | ~ | ~ | Zen + | 16 / 32 | 3.5 / 4.4 | 180W | @Amazon |
| AMD Threadripper 2970WX | ~ | ~ | Zen + | 24 / 48 | 3.0 / 4.2 | 250W | @Amazon |
| AMD Ryzen 7 2700 | ~ | ~ | Zen+ | 8 / 16 | 3.2 / 4.1 | 65W | @Amazon |
| AMD Threadripper 1900X (GM) | ~ | ~ | Zen | 8 / 16 | 3.8 / 4.0 | 180W | @Amazon |
| Intel Core i7-7700 | ~ | ~ | Kaby Lake | 4 / 8 | 3.6 / 4.2 | 65W | @Amazon |
| AMD Ryzen 5 2600 | ~ | ~ | Zen+ | 6 / 12 | 3.4 / 3.9 | 65W | @Newegg |
| Intel Core i7-7800X | ~ | ~ | Skylake | 6 / 12 | 3.5 / 4.0 | 140W | @Newegg |
| Intel Core i5-7600K | ~ | ~ | Kaby Lake | 4 / 4 | 3.8 / 4.2 | 91W | @Amazon |
| AMD Threadripper 1950X (GM) | ~ | ~ | Zen | 16 / 32 | 3.4 / 4.0 | 180W | @Newegg |
| AMD Threadripper 1920X (GM) | ~ | ~ | Zen | 12 / 24 | 3.5 / 4.0 | 180W | @Amazon |
| Intel Core i3-9350KF | 56.42% | 65.19% | Coffee Lake | 4 / 4 | 4.0 / 4.6 | 91W | @Amazon |
| AMD Ryzen 3 5300G | 55.54% | 62.68% | Zen 3 | 4 / 8 | 4.0 / 4.2 | 65W | OEM Only |
| AMD Ryzen 7 1800X | 53.86% | 60.83% | Zen | 8 / 16 | 3.6 / 4.0 | 95W | @Newegg |
| Intel Core i5-7600 | ~ | ~ | Kaby Lake | 4 / 4 | 3.5 / 4.1 | 65W | @Amazon |
| Intel Core i3-8100 | ~ | ~ | Coffee Lake | 4 / 4 | 3.6 / – | 65W | @Amazon |
| Intel Core i5-7500 | ~ | ~ | Kaby Lake | 4 / 4 | 3.4 / 3.8 | 65W | @Amazon |
| Intel Core i5-7400 | ~ | ~ | Kaby Lake | 4 / 4 | 3.0 / 3.5 | 65W | @Amazon |
| AMD Ryzen 7 1700X | ~ | ~ | Zen | 8 / 16 | 3.8 / 3.9 | 95W | @Amazon |
| AMD Ryzen 5 1600AF | ~ | ~ | Zen + | 6 / 12 | 3.2 / 3.6 | 65W | @Amazon |
| AMD Ryzen 7 1700 | ~ | ~ | Zen | 8 / 16 | 3.0 / 3.8 | 65W | @Newegg |
| Intel Core i3-8350K | 53.84% | 61.82% | Coffee Lake | 4 / 4 | 4.0 / – | 91W | Core i3 i3-8350K |
| Intel Core i3-9100 | 51.96% | 60.1% | Coffee Lake-R | 4 / 4 | 3.6 / 4.2 | 65W | @Newegg |
| AMD Ryzen 5 1600X | 49.99% | 57.28% | Zen | 6 / 12 | 3.6 / 4.0 | 95W | @Amazon |
| AMD Ryzen 5 1600 | ~ | ~ | Zen | 6 / 12 | 3.2 / 3.6 | 65W | @Amazon |
| AMD Ryzen 5 3400G | 48.81% | 55.73% | Zen + | 4 / 8 | 3.7 / 4.2 | 65W | @Amazon |
| Intel Core i5-7400 | ~ | ~ | Kaby Lake | 4 / 4 | 3.0 / 3.5 | 65W | @Newegg |
| Intel Core i3-8100 | 48.43% | 59.7% | Coffee Lake | 4 / 4 | 3.6 / – | 65W | @Amazon |
| AMD Ryzen 3 3200G | 45.96% | 52.98% | Zen + | 4 / 4 | 3.6 / 4.0 | 65W | @Amazon |
| AMD Ryzen 5 2400G | 44.84% | 50.67% | Zen+ | 4 / 8 | 3.6 / 3.9 | 65W | @Newegg |
| AMD Ryzen 5 1500X | ~ | ~ | Zen | 4 / 8 | 3.5 / 3.7 | 65W | @Newegg |
| Intel Core i3-7350K | ~ | ~ | Kaby Lake | 2 / 4 | 4.2 / – | 60W | @Newegg |
| Intel Pentium G5600 | ~ | ~ | Coffee Lake | 2 / 4 | 3.9 / – | 54W | @Newegg |
| AMD Ryzen 3 2200G | 42.16% | 48.56% | Zen+ | 4 / 4 | 3.5 / 3.7 | 65W | @Amazon |
| AMD Ryzen 3 1300X | ~ | ~ | Zen | 4 / 4 | 3.5 / 3.7 | 65W | @Amazon |
| Intel Core i3-7300 | ~ | ~ | Kaby Lake | 2 / 4 | 4.0 / – | 51W | @BH&Photo |
| Intel Pentium G5600 | 37.52% | 44.7% | Coffee Lake | 2 / 4 | 3.9 / – | 54W | @Intel |
| Intel Pentium G5400 | 36.57% | 43.31% | Coffee Lake | 2 / 4 | 3.7 / – | 54W | @Amazon |
| Intel Core i3-7100 | ~ | ~ | Kaby Lake | 2 / 4 | 3.9 / – | 51W | @Amazon |
| AMD Ryzen 5 1400 | ~ | ~ | Zen | 4 / 8 | 3.2 / 3.4 | 65W | @Amazon |
| Intel Pentium G4620 | ~ | ~ | Kaby Lake | 2 / 4 | 3.7 / – | 54W | @Newegg |
| Intel Pentium G4560 | ~ | ~ | Kaby Lake | 2 / 4 | 3.5 / – | 54W | @Newegg |
| AMD Athlon 3000G | ~ | ~ | Zen+ | 2 / 4 | 3.5 / – | 35W | @Amazon |
| AMD Athlon 240GE | ~ | ~ | Zen | 2 / 4 | 3.5 / – | 35W | @Amazon |
| AMD Athlon 220GE | ~ | ~ | Zen | 2 / 4 | 3.4 / – | 35W | @Amazon |
| AMD Athlon 200GE | ~ | ~ | Zen | 2 / 4 | 3.2 / – | 35W | @Amazon |
| AMD Ryzen 3 1200 | ~ | ~ | Zen | 4 / 4 | 3.1 / 3.2 | 65W | @Amazon |
| Zhaoxin KaiXian KX-U6780A | ~ | ~ | LuJiaZui | 8 / 8 | 2.7 / – | 70W | N/A |
| AMD A10-9700 | ~ | ~ | Bristol Ridge | 4 / 4 | 3.5 / 3.8 | 65W | @Newegg |
These tests are from our 2022 test bench. We measured performance for the 1080p CPU gaming benchmarks with a geometric mean of Borderlands 3, Hitman 2, Far Cry 5, Project CARS 3, Red Dead Redemption 2, and Shadow of the Tomb Raider. We measured performance for the 1440p CPU gaming benchmarks with a geometric mean of Borderlands 3, Project CARS 3, Far Cry 5, Red Dead Redemption 2, and Shadow of the Tomb Raider. We conducted these tests in Windows 10.
Legacy: Single-Threaded CPU Benchmarks Rankings 2022
| Single-Threaded App Score | Architecture | Cores/Threads | Base/Boost GHz | TDP | |
|---|---|---|---|---|---|
| Intel Core i9-11900K (ABT off/on) | 100% / 99.57% | Rocket Lake | 8 / 16 | 3.5 / 5.3 | 125W |
| AMD Ryzen 9 5950X | 95.31% | Zen 3 | 16 / 32 | 3.4 / 4.9 | 105W |
| Core i9-12900K DDR5 / DDR4 | 95.16% / 94.64% | Alder Lake | 16 / 24 (8P+8E) | 3.2 / 5.2 | 125 / 241W |
| Core i7-11700K | 94.29% | Rocket Lake | 8 / 16 | 3.6 / 5.0 | 95W |
| AMD Ryzen 9 5900X | 93.69% | Zen 3 | 12 / 24 | 3.7 / 4.8 | 105W |
| AMD Ryzen 7 5800X | 92.84% | Zen 3 | 8 / 16 | 3.8 / 4.7 | 105W |
| Intel Core i5-11600K | 92.56% / 89.67% | Rocket Lake | 8 / 16 | 3.9 / 4.9 | 125W |
| Intel Core i7-12700K DDR5 / DDR4 | 91.60% | Alder Lake | 12 / 20 (8P+4E) | 3.6 / 4.9 | 125W / 190W |
| AMD Threadripper Pro 5975WX | 89.25% | Zen 3 | 64 / 128 | 2.7 / 4.5 | 280W |
| AMD Ryzen 5 5600X | 89.19% | Zen 3 | 6 / 12 | 3.7 / 4.6 | 65W |
| Ryzen 7 5700G | 88.92% | Zen 3 | 8 / 16 | 3.9 / 4.4 | 65W |
| AMD Threadripper Pro 5995WX | 88.48% | Zen 3 | 64 / 128 | 3.6 / 4.5 | 280W |
| Core i5-12600K DDR4 / DDR5 | 87.85% / 87.82% | Alder Lake | 10 / 16 (6P+4E) | 3.7 / 4.9 | 125 / 150W |
| Intel Core i9-10900K | 86.68% | Comet Lake | 10 / 20 | 3.7 / 5.3 | 125W |
| AMD Ryzen 5 5600G | 85.75% | Zen 3 | 6 / 12 | 3.9 / 4.4 | 65W |
| Intel Core i9-10850K | 84.87% | Comet Lake | 10 / 20 | 3.6 / 5.2 | 95W |
| Intel Core i9-9900KS | 83.13% | Coffee Lake-R | 8 / 16 | 4.0 / 5.0 | 127W |
| Intel Core i5-11400 | 83.09% | Rocket Lake | 6 / 12 | 2.6 / 4.4 | 65W |
| Intel Core i9-9900K | 82.63% | Coffee Lake-R | 8 / 16 | 3.6 / 5.0 | 95W |
| Intel Core i7-10700K | 82.31% | Comet Lake | 8 / 16 | 3.8 / 5.1 | 125W |
| AMD Ryzen 3 5300G | 81.51% | Zen 3 | 4 / 8 | 4.0 / 4.2 | 65W |
| Intel Core i7-9700K | 80.36% | Coffee Lake-R | 8 / 8 | 3.6 / 4.9 | 95W |
| AMD Ryzen 7 3800XT | 79.75% | Zen 2 | 8 / 16 | 3.9 / 4.7 | 105W |
| AMD Ryzen 5 3600XT | 79.11% | Zen 2 | 6 / 12 | 3.8 / 4.5 | 95W |
| AMD Ryzen 9 3900XT | 78.86% | Zen 2 | 12 / 24 | 3.8 / 4.7 | 105W |
| Intel Core i5-10600K | 78.79% | Comet Lake | 6 / 12 | 4.1 / 4. | 125W |
| AMD Ryzen 7 3800X | 78.37% | Zen 2 | 8 / 16 | 3.9 / 4.5 | 105W |
| AMD Ryzen 9 3950X | 78.18% | Zen 2 | 16 / 32 | 3.5 / 4.7 | 105W |
| AMD Ryzen 9 3900X | 77.68% | Zen 2 | 12 / 24 | 3.8 / 4.6 | 105W |
| Intel Core i7-10700/F | ~ | Comet Lake | 8 / 16 | 2.9 / 4.8 | 65W |
| Ryzen 7 4750G | 77.2% | Zen 3 | 8 /16 | 3.6 / 4.4 | 65W |
| AMD Threadripper 3970X | 76.52% | Zen 2 | 32 / 64 | 3.7 / 4.5 | 280W |
| AMD Threadripper 3960X | 76.42% | Zen 2 | 24 / 48 | 3.8 / 4.5 | 280W |
| AMD Threadripper Pro 3975WX | 76.36% | Zen 2 | 32 / 64 | 3.5 / 4.2 | 280W |
| Intel Core i7-8700K | 76.32% | Coffee Lake | 6 / 12 | 3.7 / 4.7 | 95W |
| AMD Ryzen 7 3700X | 76.29% | Zen 2 | 8 / 16 | 3.6 / 4.4 | 65W |
| Intel Core i7-8086K | 76.21% | Coffee Lake | 6 / 12 | 4.0 / 5.0 | 95W |
| AMD Ryzen 5 3600X | 75.85% | Zen 2 | 6 / 12 | 3.8 / 4.4 | 95W |
| Intel Core i3-9350KF | 75.72% | Coffee Lake | 4 / 4 | 4.0 / 4.6 | 91W |
| AMD Ryzen 3 3300X | 75.62% | Zen 2 | 4 / 8 | 3.8 / 4.3 | 65W |
| Intel Core i5-9600K | 75.41% | Coffee Lake-R | 6 / 6 | 3.7 / 4.6 | 95W |
| Intel Core i9-10980XE | 75.24% | Cascade Lake-X | 18 / 36 | 3.0 / 4.8 | 165W |
| AMD Threadripper 3990X | 75.10% | Zen 2 | 64 / 128 | 2.9 / 4.3 | 280W |
| Intel Core i7-8700 | 74.66% | Coffee Lake | 6 / 12 | 3.2 / 4.6 | 65W |
| AMD Threadripper Pro 3995WX | 74.20% | Zen 2 | 64 / 128 | 2.7 / 4.2 | 280W |
| AMD Ryzen 5 3600 | 73.02% | Zen 2 | 6 / 12 | 3.6 / 4.2 | 65W |
| Intel Core i9-9980XE | ~ | Skylake | 18 / 36 | 4.4 / 4.5 | 165W |
| Intel Core i7-7700K | ~ | Kaby Lake | 4 / 8 | 4.2 / 4.5 | 91W |
| Intel Core i5-8600K | 71.08% | Coffee Lake | 6 / 6 | 3.6 / 4.3 | 95W |
| Core i3-10100 | 70.80% | Coffee Lake | 4 / 8 | 3.6 / 4.3 | 65W |
| AMD Ryzen 7 2700X | 69.53% | Zen+ | 8 / 16 | 3.7 / 4.3 | 105W |
| Intel Core i3-9100 | 69.20% | Coffee Lake-R | 4 / 4 | 3.6 / 4.2 | 65W |
| AMD Ryzen 3 3100 | 67.74% | Zen 2 | 4 / 8 | 3.8 / 3.9 | 65W |
| Intel Core i5-9400 / -9400F | 67.67% | Coffee Lake | 6 / 6 | 2.9 / 4.1 | 65W |
| Intel Xeon W-3175X | 67.51% | Skylake | 28 / 56 | 3.1 / 3.8 | 225W |
| AMD Ryzen 5 2600X | 66.78% | Zen+ | 6 / 12 | 3.6 / 4.2 | 95W |
| Intel Core i3-8350K / -8350KF | 66.71% | Coffee Lake | 4 / 4 | 4.0 / – | 91W |
| Intel Core i5-8400 | 66.03% | Coffee Lake | 6 / 6 | 2.8 / 4.0 | 65W |
| AMD Ryzen 5 3500X | ~ | Zen 2 | 6 / 6 | 3.6 / 4.1 | 65W |
| AMD Ryzen 9 3900 | ~ | Zen 2 | 12 / 24 | 3.1 / 4.3 | 65W |
| Intel Core i3-7100 | ~ | Kaby Lake | 2 / 4 | 3.9 / – | 51W |
| AMD Threadripper 2950X | ~ | Zen + | 16 / 32 | 3.5 / 4.4 | 180W |
| AMD Threadripper 2990WX | ~ | Zen+ | 32 / 64 | 3.0 / 4.2 | 250W |
| AMD Threadripper 2970WX | ~ | Zen + | 24 / 48 | 3.0 / 4.2 | 250W |
| AMD Ryzen 5 3400G | 64.86% | Zen + | 4 / 8 | 3.7 / 4.2 | 65W |
| AMD Ryzen 5 1600X | 63.62% | Zen | 6 / 12 | 3.6 / 4.0 | 95W |
| AMD Ryzen 7 1800X | 61.99% | Zen | 8 / 16 | 3.6 / 4.0 | 95W |
| Intel Core i5-7400 | ~ | Kaby Lake | 4 / 4 | 3.0 / 3.5 | 65W |
| AMD Ryzen 3 3200G | 60.90% | Zen + | 4 / 4 | 3.6 / 4.0 | 65W |
| AMD Ryzen 5 2400G | 60.79% | Zen+ | 4 / 8 | 3.6 / 3.9 | 65W |
| AMD Ryzen 3 1300X | ~ | Zen | 4 / 4 | 3.5 / 3.7 | 65W |
| AMD Ryzen 5 1600AF | ~ | Zen | 6 / 12 | 3.2 / 3.6 | 65W |
| Intel Pentium G5600 | 60.13% | Coffee Lake | 2 / 4 | 3.9 / – | 54W |
| Intel Core i3-8100 | 60.12% | Coffee Lake | 4 / 4 | 3.6 / – | 65W |
| AMD Ryzen 3 2200G | 57.09% | Zen | 4 / 4 | 3.5 / 3.7 | 65W |
| Intel Pentium G5400 | 56.79% | Coffee Lake | 2 / 4 | 3.7 / – | 54W |
| AMD Athlon 3000G | ~ | Zen+ | 2 / 4 | 3.5 / – | 35W |
| AMD Athlon 220GE | ~ | Zen | 2 / 4 | 3.4 / – | 35W |
| Intel Pentium G4560 | ~ | Kaby Lake | 2 / 4 | 3.5 / – | 54W |
| AMD Athlon 200GE | ~ | Zen | 2 / 4 | 3.2 / – | 35W |
| AMD A10-9700 | ~ | Bristol Ridge | 4 / 4 | 3.5 / 3.8 | 65W |
| Zhaoxin KaiXian KX-U6780A | ~ | LuJiaZui | 8 / 8 | 2.7 / – | 70W |
These results are from our 2022 test bench. We calculate the above single-threaded CPU benchmarks rankings based on a geometric mean of the Cinebench, POV-Ray, and LAME CPU benchmarks. The most powerful chip gets a 100, and all others are scored relative to it. We conducted these tests in Windows 10.
Legacy: Multi-Threaded CPU Benchmarks Rankings 2022
| Multi-Threaded App Score | Architecture | Cores/Threads | Base/Boost GHz | TDP | |
|---|---|---|---|---|---|
| AMD Threadripper Pro 5995WX | 112.53% | Zen 3 | 64 / 128 | 2.7 / 4.5 | 280W |
| AMD Threadripper 3990X | 100.0% | Zen 2 | 64 / 128 | 2.9 / 4.3 | 280W |
| AMD Threadripper Pro 3995WX | 97.59% | Zen 2 | 64 / 128 | 2.7 / 4.2 | 280W |
| AMD Threadripper Pro 5975WX | 93.14% | Zen 3 | 32 / 64 | 3.6 / 4.5 | 280W |
| AMD Threadripper Pro 3975WX | 82.59% | Zen 2 | 32 / 64 | 3.5 / 4.2 | 280W |
| AMD Threadripper 3970X | 75.74% | Zen 2 | 32 / 64 | 3.7 / 4.5 | 280W |
| AMD Threadripper 3960X | 64.76% | Zen 2 | 24 / 48 | 3.8 / 4.5 | 280W |
| Intel Xeon W-3175X | 59.95% | Skylake | 28 / 56 | 3.1 / 4.3 | 225W |
| AMD Ryzen 9 5950X | 53.58% | Zen 3 | 16 / 32 | 3.4 / 4.9 | 105W |
| AMD Ryzen 9 3950X | 47.32% | Zen 2 | 16 / 32 | 3.5 / 4.7 | 105W |
| AMD Ryzen 9 5900X | 45.89% | Zen 3 | 12 / 24 | 3.7 / 4.8 | 105W |
| Intel Core i9-10980XE | 43.06% | Cascade Lake-X | 18 / 36 | 3.0 / 4.8 | 165W |
| Intel Core i9-9980XE | ~ | Skylake | 18 / 36 | 4.4 / 4.5 | 165W |
| AMD Threadripper 2990WX | ~ | Zen+ | 32 / 64 | 3.0 / 4.2 | 250W |
| AMD Ryzen 9 3900X | 38.69% | Zen 2 | 12 / 24 | 3.8 / 4.6 | 105W |
| AMD Ryzen 9 3900XT | 38.66% | Zen 2 | 12 / 24 | 3.8 / 4.7 | 105W |
| Core i9-12900K DDR4 / DDR5 | 38.39% / 38.11% | Alder Lake | 16 / 24 (8P+8E) | 3.2 / 5.2 | 125 / 241W |
| Intel Core i9-11900K (ABT off/on) | 36.01% / 37.07% | Rocket Lake | 8 / 16 | 3.5 / 5.3 | 125W |
| AMD Threadripper 2970WX | ~ | Zen + | 24 / 48 | 3.0 / 4.2 | 250W |
| Core i7-11700K | 34.26% | Rocket Lake | 8 / 16 | 3.6 / 5.0 | 125W |
| Intel Core i9-10900K | 33.79% | Comet Lake | 10 / 20 | 3.7 / 5.3 | 125W |
| AMD Ryzen 7 5800X | 33.48% | Zen 3 | 8 / 16 | 3.8 / 4.7 | 105W |
| Intel Core i9-10850K | 33.38% | Comet Lake | 10 / 20 | 3.6 / 5.2 | 95W |
| AMD Threadripper 2950X | ~ | Zen + | 16 / 32 | 3.5 / 4.4 | 180W |
| AMD Ryzen 9 3900 | ~ | Zen 2 | 12 / 24 | 3.1 / 4.3 | 65W |
| Ryzen 7 5700G | 29.73% | Zen 3 | 8 / 16 | 3.8 / 4.6 | 65W |
| Intel Core i9-9900KS | 29.11% | Coffee Lake-R | 8 / 16 | 4.0 / 5.0 | 127W |
| Core i7-12700K DDR5 / DDR4 | 28.77% / 28.77% | Alder Lake | 12 / 20 (8P+4E) | 2.7 / 3.8 | 125 / 190W |
| AMD Ryzen 7 3800XT | 28.49% | Zen 2 | 8 / 16 | 3.9 / 4.7 | 105W |
| AMD Ryzen 7 3800X | 28.25% | Zen 2 | 8 / 16 | 3.9 / 4.5 | 105W |
| Intel Core i7-10700K | 28.17% | Comet Lake | 8 / 16 | 3.8 / 5.1 | 125W |
| Intel Core i9-9900K | 27.78% | Coffee Lake-R | 8 / 16 | 3.6 / 5.0 | 95W |
| AMD Ryzen 7 3700X | 27.47% | Zen 2 | 8 / 16 | 3.6 / 4.4 | 65W |
| Intel Core i5-11600K | 26.79% | Rocket Lake | 8 / 16 | 3.9 / 4.9 | 125W |
| AMD Ryzen 5 5600X | 26.15% | Zen 3 | 6 / 12 | 3.7 / 4.6 | 65W |
| AMD Ryzen 7 4750G | 26.06% | Zen 3 | 8 / 16 | 3.6 / 4.4 | 65W |
| Intel Core i7-10700/F | ~ | Comet Lake | 8 / 16 | 2.9 / 4.8 | 65W |
| Intel Core i5-11400 | 24.46% | Rocket Lake | 6 / 12 | 2.6 / 4.4 | 65W |
| AMD Ryzen 5 5600G | 23.33% | Zen 3 | 6 / 12 | 3.9 / 4.4 | 65W |
| Core i5-12600K DDR4 / DDR5 | 2308% / 23.07% | Alder Lake | 10 / 16 (6P+4E) | 3.7 / 4.9 | 125 / 150W |
| Intel Core i7-9700K | 22.81% | Coffee Lake-R | 8 / 8 | 3.6 / 4.9 | 95W |
| AMD Ryzen 5 3600XT | 22.28% | Zen 2 | 6 / 12 | 3.8 / 4.5 | 95W |
| AMD Ryzen 5 3600X | 21.76% | Zen 2 | 6 / 12 | 3.8 / 4.4 | 95W |
| AMD Ryzen 5 3600 | 21.41% | Zen 2 | 6 / 12 | 3.6 / 4.2 | 65W |
| AMD Ryzen 7 2700X | 21.59% | Zen+ | 8 / 16 | 3.7 / 4.3 | 105W |
| Intel Core i5-10600K | 20.83% | Comet Lake | 6 / 12 | 4.1 / 4.8 | 125W |
| Intel Core i7-8700K | 20.23% | Coffee Lake | 6 / 12 | 3.7 / 4.7 | 95W |
| Core i7-8700 | 20.04% | Coffee Lake | 6 / 12 | 3.2 / 4.6 | 65W |
| Core i7-8086K | 19.30% | Coffee Lake | 6 / 12 | 4.0 / 5.0 | 95W |
| AMD Ryzen 7 1800X | 19.17% | Zen | 8 / 16 | 3.6 / 4.0 | 95W |
| AMD Ryzen 5 2600X | 16.96% | Zen+ | 6 / 12 | 3.6 / 4.2 | 95W |
| Intel Core i5-9600K | 16.60% | Coffee Lake-R | 6 / 6 | 3.7 / 4.6 | 95W |
| AMD Ryzen 5 3500X | ~ | Zen 2 | 6 / 6 | 3.6 / 4.1 | 65W |
| Intel Core i7-7700K | ~ | Kaby Lake | 4 / 8 | 4.2 / 4.5 | 91W |
| Intel Core i5-8600K | 15.93% | Coffee Lake | 6 / 6 | 3.6 / 4.3 | 95W |
| AMD Ryzen 3 5300G | 15.83% | Zen 3 | 4 / 8 | 4.0 / 4.2 | 65W |
| AMD Ryzen 3 3300X | 15.55% | Zen 2 | 4 / 8 | 3.8 / 4.3 | 65W |
| AMD Ryzen 5 1600AF | ~ | Zen | 6 / 12 | 3.2 / 3.6 | 65W |
| AMD Ryzen 5 1600X | 15.16% | Zen | 6 / 12 | 3.6 / 4.0 | 95W |
| Intel Core i5-9400 / -9400F | 15.04% | Coffee Lake | 6 / 6 | 2.9 / 4.1 | 65W |
| Intel Core i5-8400 | 14.76% | Coffee Lake | 6 / 6 | 2.8 / 4.0 | 65W |
| AMD Ryzen 3 3100 | 14.17% | Zen 2 | 4 / 8 | 3.8 / 3.9 | 65W |
| Core i3-10100 | 13.37% | Rocket Lake | 4 / 8 | 3.6 / 4.3 | 65W |
| Intel Core i3-9350KF | 11.76% | Coffee Lake | 4 / 4 | 4.0/4.6 | 91W |
| AMD Ryzen 5 3400G | 11.31% | Zen + | 4 / 8 | 3.7 / 4.2 | 65W |
| Intel Core i3-8350K | 10.74% | Coffee Lake | 4 / 4 | 4.0 / – | 91W |
| Intel Core i3-9100 | 10.70% | Coffee Lake-R | 4 / 4 | 3.6 / 4.2 | 65W |
| AMD Ryzen 5 2400G | 10.56% | Zen+ | 4 / 8 | 3.6 / 3.9 | 65W |
| Intel Core i3-8100 | 9.61% | Coffee Lake | 4 / 4 | 3.6 / – | 65W |
| Intel Core i5-7400 | ~ | Kaby Lake | 4 / 4 | 3.0 / 3.5 | 65W |
| AMD Ryzen 3 3200G | 8.66% | Zen + | 4 / 4 | 3.6 / 4.0 | 65W |
| AMD Ryzen 3 1300X | ~ | Zen | 4 / 4 | 3.5 / 3.7 | 65W |
| Intel Core i3-7100 | ~ | Kaby Lake | 2 / 4 | 3.9 / – | 51W |
| AMD Ryzen 3 2200G | 7.99% | Zen | 4 / 4 | 3.5 / 3.7 | 65W |
| Intel Pentium G5600 | 5.43% | Coffee Lake | 2 / 4 | 3.9 / – | 54W |
| AMD Athlon 3000G | ~ | Zen+ | 2 / 4 | 3.5 / – | 35W |
| AMD Athlon 220GE | ~ | Zen | 2 / 4 | 3.4 / – | 35W |
| Intel Pentium G5400 | 5.13% | Coffee Lake | 2 / 4 | 3.7 / – | 54W |
| AMD Athlon 200GE | ~ | Zen | 2 / 4 | 3.2 / – | 35W |
| Intel Pentium G4560 | ~ | Kaby Lake | 2 / 4 | 3.5 / – | 54W |
| AMD A10-9700 | ~ | Bristol Ridge | 4 / 4 | 3.5 / 3.8 | 65W |
| Zhaoxin KaiXian KX-U6780A | ~ | LuJiaZui | 8 / 8 | 2.7 / – | 70W |
These tests are from our 2022 test bench. The multi-threaded workload column is based on CPU benchmarks performance in Cinebench, POV-ray, vray, Blender (four tests – Koro, Barcellona, Classroom, bmw27), y-cruncher, and Handbrake x264 and x265 workloads. These CPU benchmarks represent performance in productivity-focused applications that tend to require more compute horsepower. The most powerful chip gets a 100, and all others are scored relative to it. We conducted these benchmarks in Windows 10.
| 1080p Gaming Score | 1440p Gaming Score | CPU | Cores/Threads | Base/Boost GHz | TDP | Buy | |
|---|---|---|---|---|---|---|---|
| Intel Core i9-12900K DDR4 / DDR5 | 100% / 93.51% | 100% / 95.86% | Alder Lake | 16 / 24 (8P+8E) | 3.2 / 5.2 | 125 / 241W | Core i9-12900K |
| Intel Core i9-11900K | 92.48% | 97.26% | Rocket Lake | 8 / 16 | 3.5 / 5.3 | 125W | Core i9-11900K |
| Intel Core i7-12700K DDR4 / DDR5 | 97.71% / 91.23% | 99.8% / 97.30% | Alder Lake | 12 / 20 (8P+4E) | 3.6 / 4.9 | 125 / 190W | Core i7-12700K |
| AMD Ryzen 9 5900X | 90.98% | 93.18% | Zen 3 | 12 / 24 | 3.7 / 4.8 | 105W | Ryzen 9 5900X |
| Intel Core i5-12600K DDR4 / DDR5 | 90.89% / 84.32% | 96.94% / 92.33% | Alder Lake | 10 / 16 (6P+4E) | 3.7 / 4.9 | 125 / 150W | Core i5-12600K |
| AMD Ryzen 9 5950X | 90.22% | 95.32% | Zen 3 | 16 / 32 | 3.4 / 4.9 | 105W | Ryzen 9 5950X |
| AMD Threadripper Pro 5975WX | 88.71% | 89.71% | Zen 3 | 32 / 64 | 3.6 / 4.5 | 280W | Threadripper Pro 5975WX |
| AMD Ryzen 5 5600X | 88.51% | 91.79% | Zen 3 | 6 / 12 | 3.7 / 4.6 | 65W | Ryzen 5 5600X |
| AMD Ryzen 7 5800X | 86.85% | 91.72% | Zen 3 | 8 / 16 | 3.8 / 4.7 | 105W | Ryzen 7 5800X |
| Intel Core i7-11700K | 86.3% | 92.0% | Rocket Lake | 8 / 16 | 3.6 / 5.0 | 125W | Core i7-11700K |
| AMD Threadripper Pro 5995WX | 86.12% | 84.79% | Zen 3 | 64 / 128 | 2.7 / 4.5 | 280W | Threadripper Pro 5995WX |
| Intel Core i9-10900K | 85.01% | 91.5% | Comet Lake | 10 / 20 | 3.7 / 5.3 | 125W | Core i9-9900K |
| Intel Core i9-10850K | 84.6% | 91.07% | Comet Lake | 10 / 20 | 3.6 / 5.2 | 95W | Core i9-10850K |
| Intel Core i5-11600K | 84.06% | 90.43% | Rocket Lake | 6 / 12 | 3.9 / 4.9 | 125W | Core i5-11600K |
| Intel Core i5-11400 | 80.98% | 87.77% | Rocket Lake | 6 / 12 | 2.6 / 4.4 | 65W | Core i5-11400 |
| Intel Core i7-10700K | 80.66% | 87.88% | Comet Lake | 8 / 16 | 3.8 / 5.1 | 125W | Core i7-10700K |
| Intel Core i9-10980XE | 78.04% | 84.04% | Cascade Lake-X | 18 / 36 | 3.0 / 4.8 | 165W | Core i9-10980XE |
| Intel W-3175X | 76.93% | 82.58% | Skylake | 28 / 56 | 3.1 / 4.3 | 225W | @Newegg |
| Ryzen 7 5700G* | 76.61% | 83.1% | Zen 3 | 8 / 16 | 3.8 / 4.6 | 65W | N/A |
| Intel Core i9-9900KS | 76.12% | 84.85% | Coffee Lake-R | 8 / 16 | 4.0 / 5.0 | 127W | Intel Core i9-9900KS |
| Intel Core i7-10700/F | ~ | ~ | Comet Lake | 8 / 16 | 2.9 / 4.8 | 65W | Intel Core i7-10700 |
| Intel Core i5-10600K | 75.42% | 82.57% | Comet Lake | 6 / 12 | 4.1 / 4.8 | 125W | @Newegg |
| Intel Core i7-9700K | 73.62% | 81.12% | Coffee Lake-R | 8 / 8 | 3.6 / 4.9 | 95W | @Amazon |
| Intel Core i9-9900K / F | 73.41% | 84.85% | Coffee Lake-R | 8 / 16 | 3.6 / 5.0 | 95W | Core i9-9900K |
| AMD Ryzen 9 3950X | 72.63% | 78.58% | Zen 2 | 16 / 32 | 3.5 / 4.7 | 105W | @Amazon |
| AMD Threadripper 3970X | 72.44% | 77.99% | Zen 2 | 32 / 64 | 3.7 / 4.5 | 280W | AMD Threadripper 3970X |
| AMD Threadripper 3960X | 72.07% | 77.12% | Zen 2 | 24 / 48 | 3.8 / 4.5 | 280W | AMD Ryzen Threadripper 3960X |
| AMD Ryzen 5 5600G | 71.99% | 76.76% | Zen 3 | 6 / 12 | 3.9 / 4.4 | 65W | Ryzen 5 5600G |
| AMD Ryzen 7 3800XT | 71.78% | 79.28% | Zen 2 | 8 / 16 | 3.9 / 4.7 | 105W | @Newegg |
| AMD Threadripper 3990X | 71.68% | 77.94% | Zen 2 | 64 / 128 | 2.9 / 4.3 | 280W | AMD Ryzen Threadripper 3990X |
| AMD Ryzen 9 3900XT | 71.67% | 78.55% | Zen 2 | 12 / 24 | 3.8 / 4.7 | 105W | Ryzen 9 3900XT |
| AMD Ryzen 9 3900X | ~ | ~ | Zen 2 | 12 / 24 | 3.8 / 4.6 | 105W | @Amazon |
| Intel Core i9-9980XE | ~ | ~ | Skylake | 18 / 36 | 4.4 / 4.5 | 165W | @B&HPhoto |
| AMD Ryzen 9 3900 | ~ | ~ | Zen 2 | 12 / 24 | 3.1 / 4.3 | 105W | OEM only |
| AMD Ryzen 7 3700X | 71.43% | 79.08% | Zen 2 | 8 / 16 | 3.6 / 4.4 | 65W | Ryzen 7 3700X |
| AMD Ryzen 7 3800X | 71.3% | 78.67% | Zen 2 | 8 / 16 | 3.9 / 4.5 | 105W | Ryzen 7 3800X |
| AMD Ryzen 5 3600XT | 70.62% | 77.75% | Zen 2 | 6 / 12 | 3.8 / 4.5 | 95W | @Newegg |
| AMD Ryzen 5 3600 | 68.63% | 75.59% | Zen 2 | 6 / 12 | 3.6 / 4.2 | 65W | @Amazon |
| Intel Core i9-7960X | ~ | ~ | Skylake | 16 / 32 | 2.8 / 4.2 | 165W | @Newegg |
| Intel Core i7-8700K | 68.47% | 76.41% | Coffee Lake | 6 / 12 | 3.7 / 4.7 | 95W | @Amazon |
| AMD Ryzen 5 3600X | 68.41% | 75.60% | Zen 2 | 6 / 12 | 3.8 / 4.4 | 95W | @Newegg |
| AMD Threadripper Pro 3975WX | 67.63% | 74.42% | Zen 2 | 32 / 64 | 3.5 / 4.2 | 280W | Threadripper Pro 3975WX |
| AMD Ryzen 3 3300X | 67.49% | 74.6% | Zen 2 | 4 / 8 | 3.8 / 4.3 | 65W | @Newegg |
| Intel Core i5-9600K | 67.06% | 75.11% | Coffee Lake-R | 6 / 6 | 3.7 / 4.6 | 95W | @Newegg |
| AMD Threadripper Pro 3995WX | 66.18% | 69.28% | Zen 2 | 64 / 128 | 2.7 / 4.2 | 280W | Threadripper Pro 3995WX |
| Intel Core i5-8600K | 65.84% | 73.4% | Coffee Lake | 6 / 6 | 3.6 / 4.3 | 95W | @Newegg |
| Intel Core i7-8700 | 65.57% | 73.66% | Coffee Lake | 6 / 12 | 3.2 / 4.6 | 65W | Core i7-8700 |
| Intel Core i7-8086K | 65.05% | 73.5% | Coffee Lake | 6 / 12 | 4.0 / 5.0 | 95W | Core i7-8086K |
| Intel Core i5-9400 / i5-9400F | 64.85% | 72.08% | Coffee Lake | 6 / 6 | 2.9 / 4.1 | 65W | @Amazon |
| Intel Core i5-8400 | 63.96% | 71.2% | Coffee Lake | 6 / 6 | 2.8 / 4.0 | 65W | @Newegg |
| AMD Ryzen 5 3500X | ~ | ~ | Zen 2 | 6 / 6 | 3.6 / 4.1 | 65W | @Newegg |
| Core i3-10100 | 61.88% | 69.08% | Comet Lake | 4 / 8 | 3.6 / 4.3 | 65W | Core i3-10100 |
| AMD Ryzen 7 2700X | 59.19% | 66.55% | Zen+ | 8 / 16 | 3.7 / 4.3 | 105W | @Newegg |
| Ryzen 7 4750G* | 58.43% | 66.46% | Zen 2 | 8 / 16 | 3.8 / 4.6 | 65W | Ryzen 7 4750G |
| AMD Ryzen 3 3100 | 57.75% | 64.21% | Zen 2 | 4 / 8 | 3.8 / 3.9 | 65W | @Newegg |
| Intel Core i9-7980XE | ~ | ~ | Skylake | 18 / 36 | 2.6 / 4.2 | 165W | @Amazon |
| Intel Core i9-7900X | ~ | ~ | Skylake | 10 / 20 | 3.3 / 4.3 | 140W | @Newegg |
| AMD Ryzen 5 2600X | 57.55% | 65.33% | Zen+ | 6 / 12 | 3.6 / 4.2 | 95W | @Amazon |
| Intel Core i7-7700K | ~ | ~ | Kaby Lake | 4 / 8 | 4.2 / 4.5 | 91W | @Amazon |
| AMD Threadripper 2990WX (GM) | ~ | ~ | Zen+ | 32 / 64 | 3.0 / 4.2 | 250W | @Newegg |
| Intel Core i7-7820X | ~ | ~ | Skylake | 8 / 16 | 3.6 / 4.3 | 140W | @Amazon |
| AMD Threadripper 2950X (GM) | ~ | ~ | Zen + | 16 / 32 | 3.5 / 4.4 | 180W | @Amazon |
| AMD Threadripper 2970WX | ~ | ~ | Zen + | 24 / 48 | 3.0 / 4.2 | 250W | @Amazon |
| AMD Ryzen 7 2700 | ~ | ~ | Zen+ | 8 / 16 | 3.2 / 4.1 | 65W | @Amazon |
| AMD Threadripper 1900X (GM) | ~ | ~ | Zen | 8 / 16 | 3.8 / 4.0 | 180W | @Amazon |
| Intel Core i7-7700 | ~ | ~ | Kaby Lake | 4 / 8 | 3.6 / 4.2 | 65W | @Amazon |
| AMD Ryzen 5 2600 | ~ | ~ | Zen+ | 6 / 12 | 3.4 / 3.9 | 65W | @Newegg |
| Intel Core i7-7800X | ~ | ~ | Skylake | 6 / 12 | 3.5 / 4.0 | 140W | @Newegg |
| Intel Core i5-7600K | ~ | ~ | Kaby Lake | 4 / 4 | 3.8 / 4.2 | 91W | @Amazon |
| AMD Threadripper 1950X (GM) | ~ | ~ | Zen | 16 / 32 | 3.4 / 4.0 | 180W | @Newegg |
| AMD Threadripper 1920X (GM) | ~ | ~ | Zen | 12 / 24 | 3.5 / 4.0 | 180W | @Amazon |
| Intel Core i3-9350KF | 56.42% | 65.19% | Coffee Lake | 4 / 4 | 4.0 / 4.6 | 91W | @Amazon |
| AMD Ryzen 3 5300G | 55.54% | 62.68% | Zen 3 | 4 / 8 | 4.0 / 4.2 | 65W | OEM Only |
| AMD Ryzen 7 1800X | 53.86% | 60.83% | Zen | 8 / 16 | 3.6 / 4.0 | 95W | @Newegg |
| Intel Core i5-7600 | ~ | ~ | Kaby Lake | 4 / 4 | 3.5 / 4.1 | 65W | @Amazon |
| Intel Core i3-8100 | ~ | ~ | Coffee Lake | 4 / 4 | 3.6 / – | 65W | @Amazon |
| Intel Core i5-7500 | ~ | ~ | Kaby Lake | 4 / 4 | 3.4 / 3.8 | 65W | @Amazon |
| Intel Core i5-7400 | ~ | ~ | Kaby Lake | 4 / 4 | 3.0 / 3.5 | 65W | @Amazon |
| AMD Ryzen 7 1700X | ~ | ~ | Zen | 8 / 16 | 3.8 / 3.9 | 95W | @Amazon |
| AMD Ryzen 5 1600AF | ~ | ~ | Zen + | 6 / 12 | 3.2 / 3.6 | 65W | @Amazon |
| AMD Ryzen 7 1700 | ~ | ~ | Zen | 8 / 16 | 3.0 / 3.8 | 65W | @Newegg |
| Intel Core i3-8350K | 53.84% | 61.82% | Coffee Lake | 4 / 4 | 4.0 / – | 91W | Core i3 i3-8350K |
| Intel Core i3-9100 | 51.96% | 60.1% | Coffee Lake-R | 4 / 4 | 3.6 / 4.2 | 65W | @Newegg |
| AMD Ryzen 5 1600X | 49.99% | 57.28% | Zen | 6 / 12 | 3.6 / 4.0 | 95W | @Amazon |
| AMD Ryzen 5 1600 | ~ | ~ | Zen | 6 / 12 | 3.2 / 3.6 | 65W | @Amazon |
| AMD Ryzen 5 3400G | 48.81% | 55.73% | Zen + | 4 / 8 | 3.7 / 4.2 | 65W | @Amazon |
| Intel Core i5-7400 | ~ | ~ | Kaby Lake | 4 / 4 | 3.0 / 3.5 | 65W | @Newegg |
| Intel Core i3-8100 | 48.43% | 59.7% | Coffee Lake | 4 / 4 | 3.6 / – | 65W | @Amazon |
| AMD Ryzen 3 3200G | 45.96% | 52.98% | Zen + | 4 / 4 | 3.6 / 4.0 | 65W | @Amazon |
| AMD Ryzen 5 2400G | 44.84% | 50.67% | Zen+ | 4 / 8 | 3.6 / 3.9 | 65W | @Newegg |
| AMD Ryzen 5 1500X | ~ | ~ | Zen | 4 / 8 | 3.5 / 3.7 | 65W | @Newegg |
| Intel Core i3-7350K | ~ | ~ | Kaby Lake | 2 / 4 | 4.2 / – | 60W | @Newegg |
| Intel Pentium G5600 | ~ | ~ | Coffee Lake | 2 / 4 | 3.9 / – | 54W | @Newegg |
| AMD Ryzen 3 2200G | 42.16% | 48.56% | Zen+ | 4 / 4 | 3.5 / 3.7 | 65W | @Amazon |
| AMD Ryzen 3 1300X | ~ | ~ | Zen | 4 / 4 | 3.5 / 3.7 | 65W | @Amazon |
| Intel Core i3-7300 | ~ | ~ | Kaby Lake | 2 / 4 | 4.0 / – | 51W | @BH&Photo |
| Intel Pentium G5600 | 37.52% | 44.7% | Coffee Lake | 2 / 4 | 3.9 / – | 54W | @Intel |
| Intel Pentium G5400 | 36.57% | 43.31% | Coffee Lake | 2 / 4 | 3.7 / – | 54W | @Amazon |
| Intel Core i3-7100 | ~ | ~ | Kaby Lake | 2 / 4 | 3.9 / – | 51W | @Amazon |
| AMD Ryzen 5 1400 | ~ | ~ | Zen | 4 / 8 | 3.2 / 3.4 | 65W | @Amazon |
| Intel Pentium G4620 | ~ | ~ | Kaby Lake | 2 / 4 | 3.7 / – | 54W | @Newegg |
| Intel Pentium G4560 | ~ | ~ | Kaby Lake | 2 / 4 | 3.5 / – | 54W | @Newegg |
| AMD Athlon 3000G | ~ | ~ | Zen+ | 2 / 4 | 3.5 / – | 35W | @Amazon |
| AMD Athlon 240GE | ~ | ~ | Zen | 2 / 4 | 3.5 / – | 35W | @Amazon |
| AMD Athlon 220GE | ~ | ~ | Zen | 2 / 4 | 3.4 / – | 35W | @Amazon |
| AMD Athlon 200GE | ~ | ~ | Zen | 2 / 4 | 3.2 / – | 35W | @Amazon |
| AMD Ryzen 3 1200 | ~ | ~ | Zen | 4 / 4 | 3.1 / 3.2 | 65W | @Amazon |
| Zhaoxin KaiXian KX-U6780A | ~ | ~ | LuJiaZui | 8 / 8 | 2.7 / – | 70W | N/A |
| AMD A10-9700 | ~ | ~ | Bristol Ridge | 4 / 4 | 3.5 / 3.8 | 65W | @Newegg |
Legacy: Pre-2018 Desktop CPU Benchmarks
Recognizing that a lot of older platforms are going to be paired with graphics subsystems multiple generations old, we wanted to define the top of our range to encourage balance between host processing and complementary GPUs. At this point, anyone with a Sandy Bridge-based Core i7 would realize a gain from stepping up to Coffee Lake or Kaby Lake, for example. And putting AMD’s top FX CPUs next to a handful of Core i7s and those older Core i5s represents an upgrade to their status.
Currently, our hierarchy consists of 13 total tiers. The bottom half of the chart is largely outdated; you’ll notice those CPUs dragging down performance in the latest games, whether you have one of the best graphics cards or not. If you own a CPU in that range, an upgrade could really take your experience to another level.
Really, it’s the top five tiers or so that remain viable. And in that top half of the chart, an upgrade is typically worthwhile if it’s a least a couple of tiers higher. Otherwise, there’s just not enough improvement to warrant the expense of a fresh CPU, motherboard and RAM (not to mention the graphics card and storage solution you’d be considering as well).
| Intel CPUs | AMD CPUs and APUs |
| Intel Core i7-8700K | |
| Intel Core i9-7900X | |
| Intel Core i9-7960X | |
| Intel Core i9-7980XE | |
| Intel Core i7-8700K | |
| Intel Core i7-7740X | |
| Intel Core i7-7700K | |
| Intel Core i7-7820X | AMD Ryzen Threadripper 1950X |
| Intel Core i7-7700 | AMD Ryzen Threadripper 1920X |
| Intel Core i5-8400 | AMD Ryzen 7 1800X |
| Intel Core i7-7800X | AMD Ryzen Threadripper 1900X |
| Intel Core i7-7700T | AMD Ryzen 7 1700X |
| Intel Core i7-6950X | AMD Ryzen 7 1700 |
| Intel Core i7-6900K | AMD Ryzen 5 1600X |
| Intel Core i7-6850K | AMD Ryzen 5 1600 |
| Intel Core i7-6800K | AMD Ryzen 5 1500X |
| Intel Core i7-6700K | AMD Ryzen 5 1400 |
| Intel Core i7 6700 | AMD Ryzen 3 1300X |
| Intel Core i7-5960X | Ryzen 5 2400G |
| Intel Core i7-5930K | |
| Intel Core i7-5820K | |
| Intel Core i7-5775C | |
| Intel i7-4960X | |
| Intel Core i7-4930K | |
| Intel Core i7-4820K | |
| Intel Core i7-4790K | |
| Intel Core i7-4770K | |
| Intel Core i7-4790 | |
| Intel Core i7-4771 | |
| Intel Core i7-4770 | |
| Intel Core i7-3970X | |
| Intel Core i7-3960X | |
| Intel Core i7-3930K | |
| Intel Core i7-3820 | |
| Intel Core i7-3770K | |
| Intel Core i7-3770 | |
| Intel Core i5-7640X | |
| Intel Core i5-7600K | |
| Intel Core i5-7600 | |
| Intel Core i5-7500 | |
| Intel Core i5-7400 | |
| Intel Core i5 6600K | |
| Intel Core i5-6600 | |
| Intel Core i5-6500 | |
| Intel Core i5 6402P | |
| Intel Core i5-6400 | |
| Intel Core i5-5675C | |
| Intel Core i5-4690K | |
| Intel Core i5-4670K | |
| Intel Core i5-4590 | |
| Intel Core i5-4670 | |
| Intel Core i5-4570 | |
| Intel BX80646I54460 | |
| Intel Core i5-4440 | |
| Intel Core i5-4430 | |
| Intel Core i5-3570K | |
| Intel Core i5-3570 | |
| Intel Core i5-3550 | |
| Intel CPUs | AMD CPUs and APUs |
| Intel Core i7-990X Extreme | |
| Intel Core i7-980X Extreme | |
| Intel Core i7-975 Extreme | |
| Intel Core i7-2600K | |
| Intel Core i7-2600 | |
| Intel Core i7-965 | |
| Intel Core i5-3470 | |
| Intel Core i5-3450P | Intel Core i7-7700 |
| Intel Core i5-3450 | AMD FX-9370 |
| Intel Core i5-3350P | AMD FX-8370 |
| Intel Core i5-3330 | AMD FX-8350 w/Wraith |
| Intel Core i5-2550K | AMD FX-8320 |
| Intel Core i5-2500K | AMD FX-8300 |
| Intel Core i5-2500 | AMD FX-8150 |
| Intel Core i5-2450P | |
| Intel Core i5-2400 | |
| Intel Core i5-2380P | |
| Intel Core i5-2320 | |
| Intel Core i5-2310 | |
| Intel Core i5-2300 | |
| Intel Core i3-7350K | |
| Intel Core i3-7320 | |
| Intel Core i3-7300 | |
| Intel Core i3-7100 | |
| Intel CPUs | AMD CPUs and APUs |
| Intel Core i7-980 | |
| Intel Core i7-970 | |
| Intel Core i7-960 | |
| Intel Core i7-875K | |
| Intel Core i7-870 | |
| Intel Core i3 6320 | |
| Intel Core i3 6300 | |
| Intel Core i3-6100 | AMD FX-6350 |
| Intel Core i3 6100T | AMD FX-4350 |
| Intel Core i3-6098P | AMD Phenom II X6 1100T Black Edition |
| Intel Core i3-4360 | AMD Phenom II X6 1090T Black Edition |
| Intel Core i3-4350 | AMD Phenom II X4 Black Edition 980 |
| Intel Core i3-4340 | AMD Phenom II X4 Black Edition 975 |
| Intel Core i3-4170 | |
| Intel Core i3-4160 | |
| Intel Core i3-4150 | |
| Intel Core i3-4130 | |
| Intel Core i3-3250 | |
| Intel Core i3-3245 | |
| Intel Core i3-3240 | |
| Intel Core i3-3225 | |
| Intel Core i3-3220 | |
| Intel Core i3-3210 | |
| Intel Core i3-2130 | |
| Intel Core i3-2025 | |
| Intel Core i3-2120 | |
| Intel Core i3-2105 | |
| Intel Core i3-2100 | |
| Intel Pentium G4620 | |
| Intel Pentium G4600 | |
| Intel Pentium G4560 | |
| Intel Pentium G4500 | |
| Intel Pentium G4400 | |
| Intel CPUs | AMD CPUs and APUs |
| AMD FX-8370E | |
| AMD FX-8320 | |
| AMD FX-8120 | |
| AMD FX-6300 | |
| AMD FX-6200 | |
| AMD FX-4300 | |
| AMD FX-4170 | |
| AMD Phenom II X6 1075T | |
| Intel Core i7-950 | AMD Phenom II X4 970 Black Edition |
| Intel Core i7-940 | AMD Phenom II X4 965 |
| Intel Core i7-930 | AMD Phenom II X4 955 |
| Intel Core i7-920 | AMD A10-7890K APU |
| Intel Core i7-860 | Intel A10-7870K |
| Intel Core i5-3220T | AMD A10-7860K |
| Intel Core i5-2405S | AMD A10-7850K |
| Intel Core i5-2400S | AMD A10-7800 |
| Intel Core i5-760 | AMD A10-7700K |
| Intel Core i5-750 | AMD A10-6800K |
| Intel Core 2 Extreme QX9775 | AMD A10-6790K |
| Intel Core 2 Extreme QX9770 | AMD A10-6700 |
| Intel Core 2 Extreme QX9650 | AMD A10-5800K |
| Intel Core 2 Quad Q9650 | AMD A10-5700 |
| Intel A8-7650K | |
| AMD A8-7600 | |
| AMD A8-6600K | |
| AMD A8-5600K | |
| AMD A8-3870K | |
| AMD A8-3870 | |
| AMD A8-3850 | |
| AMD Athlon X4 880K | |
| Intel Athlon X4 870K) | |
| Intel A10-7870K | |
| AMD Athlon X4 750K | |
| AMD Athlon X4 740 | |
| AMD Athlon X4 651K | |
| AMD Athlon X4 645 | |
| AMD Athlon X4 641 | |
| AMD Athlon X4 640 | |
| Intel CPUs | AMD CPUs and APUs |
| AMD FX-6100 | |
| AMD FX-4130 | |
| AMD FX-4100 | |
| Intel Core 2 Extreme QX6850 | AMD Phenom II X6 1055T |
| Intel Core 2 Extreme QX6800 | AMD Phenom II X6 1045T |
| Intel Core 2 Quad Q9550 | AMD Phenom II X4 945 |
| Intel Core 2 Quad Q9450 | AMD Phenom II X4 940 |
| Intel Core 2 Quad Q9400 | AMD Phenom II X4 920 |
| Intel Core i5-680 | AMD Phenom II X3 740 |
| Intel Core i5-670 | AMD Phenom II X3 720 Black Edition |
| Intel Core i5-661 | AMD A8-6500 |
| Intel Core i5-660 | AMD A8-5500 |
| Intel Core i5-655K | AMD A6 |
| Intel Core i5-650 | AMD A6 |
| Intel Core i3-2120T | AMD A6-3670K |
| Intel Core i3-2100T | AMD A6-3650 |
| AMD Athlon II X4 635 | |
| AMD Athlon II X4 630 | |
| Intel CPUs | AMD CPUs and APUs |
| Intel Core 2 Extreme QX6700 | |
| Intel Core 2 Quad Q9300 | |
| Intel Core 2 Quad Q8400 | |
| Intel Core 2 Quad Q8300 | |
| Intel Core 2 Quad Q6700 | |
| Intel Core 2 Quad Q6600 | |
| Intel Core 2 Duo E8600 | |
| Intel Core 2 Duo E8500 | AMD Phenom II X4 910 |
| Intel Core 2 Duo E8400 | AMD Phenom II X4 910e |
| Intel Core 2 Duo E7600 | AMD Phenom II X4 810 |
| Intel Core i3-550 | AMD Athlon II X4 631 |
| Intel Core i3-540 | AMD Athlon II X4 620 |
| Intel Core i3-530 | AMD Athlon II X3 460 |
| Intel Pentium G3470 | |
| Intel Pentium G3460 | |
| Intel Pentium G3450 | |
| Intel Pentium G3440 | |
| Intel Pentium G3430 | |
| Intel Pentium G3420 | |
| Intel Pentium G3260 | |
| Intel Pentium G3258 | |
| Intel Pentium G3250 | |
| Intel Pentium G3220 | |
| Intel Pentium G2130 | |
| Intel Pentium G2120 | |
| Intel Pentium G2020 | |
| Intel Pentium G2010 | |
| Intel Pentium G870 | |
| Intel Pentium G860 | |
| Intel Pentium G850 | |
| Intel Pentium G840 | |
| Intel Pentium G645 | |
| Intel Pentium G640 | |
| Intel Pentium G630 | |
| Intel CPUs | AMD CPUs and APUs |
| Intel Core 2 Extreme X6800 | |
| Intel Core 2 Quad Q8200 | |
| Intel Core 2 Duo E8300 | AMD Phenom II X4 905e |
| Intel Core 2 Duo E8200 | AMD Phenom II X4 805 |
| Intel Core 2 Duo E8190 | AMD Phenom II X3 710 |
| Intel Core 2 Duo E7500 | AMD Phenom II X3 705e |
| Intel Core 2 Duo E7400 | AMD Phenom II X2 565 Black Edition |
| Intel Core 2 Duo E6850 | AMD Phenom II X2 560 Black Edition |
| Intel Core 2 Duo E6750 | AMD Phenom II X2 555 Black Edition |
| Intel Pentium G620 | AMD Phenom II X2 550 Black Edition |
| Intel Celeron G1630 | AMD Phenom II X2 545 |
| Intel Celeron G1620 | AMD Phenom X4 9950 |
| Intel Celeron G1610 | AMD Athlon II X3 455 |
| Intel Celeron G555 | AMD Athlon II X3 450 |
| Intel Celeron G550 | AMD Athlon II X3 445 |
| Intel Celeron G540 | AMD Athlon II X3 440 |
| Intel Celeron G530 | AMD Athlon II X3 435 |
| Intel Celeron G3950 | AMD Athlon II X3 425 |
| Intel Celeron G3930 | |
| Intel Celeron G3930 | |
| Intel Celeron G3900 | |
| Intel CPUs | AMD CPUs and APUs |
| AMD Phenom X4 9850 | |
| AMD Phenom X4 9750 | |
| AMD Phenom X4 9650 | |
| Intel Core 2 Duo E7300 | AMD Phenom X4 9600 |
| Intel Core 2 Duo E7200 | AMD Phenom X3 8850 |
| Intel Core 2 Duo E6700 | AMD Phenom X3 8750 |
| Intel Core 2 Duo E6550 | AMD Athlon II X2 370K |
| Intel Core 2 Duo E6540 | AMD Athlon II X2 265 |
| Intel Pentium Dual-Core E6700 | AMD Athlon II X2 260 |
| Intel Pentium Dual-Core E6600 | AMD Athlon II X2 255 |
| Intel Pentium Dual-Core E650 | AMD A6-5500K |
| Intel Pentium Dual-Core E6300 | AMD A6 |
| Intel Pentium Dual-Core E5800 | AMD A4-7300 |
| Intel Pentium Dual-Core E5700 | AMD A4-6400K |
| Intel Pentium G9650 | AMD A4-6300 |
| AMD A4-5400K | |
| AMD A4-5300 | |
| AMD A4-4400 | |
| AMD A4-4000 | |
| AMD A4-3400 | |
| AMD A4-3300 | |
| AMD Sempron 2650 | |
| AMD Athlon 64 X2 6400+ | |
| Intel CPUs | AMD CPUs and APUs |
| AMD Phenom X4 9550 | |
| AMD Phenom X4 9500 | |
| AMD Phenom X4 9450e | |
| Intel Core 2 Duo E6600 | AMD Phenom X4 9350e |
| Intel Core 2 Duo E6420 | AMD Phenom X3 8650 |
| Intel Core 2 Duo E4700 | AMD Phenom X3 8600 |
| Intel Core 2 Duo E4600 | AMD Phenom X3 8550 |
| Intel Core 2 Duo E4500 | AMD Phenom X3 8450e |
| Intel Pentium Dual-Core E5400 | AMD Phenom X3 8450 |
| Intel Pentium Dual-Core E5300 | AMD Phenom X3 8400 |
| Intel Pentium Dual-Core E5200 | AMD Phenom X3 8250e |
| Intel Pentium Dual-Core G620T | AMD Athlon II X2 250 |
| AMD Athlon II X2 245 | |
| AMD Athlon II X2 240 | |
| AMD Athlon X2 7850 | |
| AMD Athlon X2 7750 | |
| AMD Athlon 64 X2 6000+ | |
| AMD Athlon 64 X2 5600+ | |
| Intel CPUs | AMD CPUs and APUs |
| AMD Phenom X4 9150e | |
| AMD Phenom X4 9100e | |
| Intel Core 2 Duo E6400 | AMD Athlon X2 7550 |
| Intel Core 2 Duo E6320 | AMD Athlon X2 7450 |
| Intel Core 2 Duo E4400 | AMD Athlon X2 5050e |
| Intel Core 2 Duo E4300 | AMD Athlon X2 4850e/b |
| Intel Celeron E3300 | AMD Athlon 64 X2 5400+ |
| AMD Athlon 64 X2 5200+ | |
| AMD Athlon 64 X2 5000+ | |
| AMD Athlon 64 X2 4800+ | |
| Intel CPUs | AMD CPUs and APUs |
| Intel Core 2 Duo E6300 | AMD Athlon X2 6550 |
| Intel Core 2 Duo E5500 | AMD Athlon X2 6500 |
| Intel Pentium Dual-Core E2220 | AMD Athlon X2 4450e/b |
| Intel Pentium Dual-Core E2200 | AMD Athlon X2 4600+ |
| Intel Pentium Dual-Core E2210 | AMD Athlon X2 4400+ |
| Intel Celeron E3200 | AMD Athlon X2 4200+ |
| AMD Athlon X2 BE-2400 | |
| Intel CPUs | AMD CPUs and APUs |
| Intel Pentium Dual-Core E2180 | AMD Athlon 64 X2 4000+ |
| Intel Celeron 1600 | AMD Athlon 64 X2 3800+ |
| Intel Celeron G440 | AMD Athlon X2 4050e |
| AMD Athlon X2 2300 Black Edition | |
| Intel CPUs | AMD CPUs and APUs |
| Intel Pentium Dual-Core E2160 | |
| Intel Pentium Dual-Core E2140 | |
| Intel Celeron E1500 | |
| Intel Celeron E1400 | |
| Intel Celeron E1200 |
- Intel Core i5-13600K vs AMD Ryzen 7 7700X and Ryzen 5 7600X Face Off
- AMD Ryzen 9 7950X vs Intel Core i9-13900K Face Off
- Ryzen 7 5800X3D vs Core i7-12700K and Core i9-12900K Face-Off: The Rise of 3D V-Cache
- Intel Core i9-12900K vs Ryzen 9 5900X and 5950X: Alder Lake and Ryzen 5000 Face Off
- Intel Core i5-12600K vs AMD Ryzen 5 5600X and 5800X Face Off: Ryzen Has Fallen
- Intel Core i7-12700K vs AMD Ryzen 9 5900X and 5800X Face Off: Intel Rising
- Intel Core i5-12400 vs AMD Ryzen 5 5600X Face-Off: The Gaming Value Showdown
- MORE: Best CPUs for Gaming
- MORE: AMD vs Intel
- MORE: Zen 4 Ryzen 7000 All We Know
- MORE: How to Overclock a CPU
- MORE: How to check CPU Temperature
- MORE: All CPUs Content
| 1080p Gaming Score | 1440p Gaming Score | Architecture | Cores/Threads (P+E) | Base/Boost GHz | TDP – MTP | Buy | |
|---|---|---|---|---|---|---|---|
| $589 – Core i9-13900K | 100.00% | 100.00% | Raptor Lake | 24 / 32 (8+16) | 3.0 / 5.8 | 125 / 253W | |
| $409 – Core i7-13700K | 96.09% | 97.09% | Raptor Lake | 16 / 24 (8+8) | 3.4 / 5.4 | 125 / 253W | |
| $365 – Ryzen 7 5800X3D | 94.42% | 97.45% | Zen 3 | 8 / 16 | 3.4 / 4.5 | 105W | |
| $319 – Core i5-13600K | 90.03% | 92.94% | Raptor Lake | 14 / 20 (6+8) | 3.5 / 5.1 | 125 / 181W | |
| $474 – Ryzen 9 7900X | 87.40% | 90.52% | Zen 4 | 12 / 24 | 4.7 / 5.6 | 170 / 230W | |
| $569 – Ryzen 9 7950X | 87.25% | 90.27% | Zen 4 | 16 / 32 | 4.5 / 5.7 | 170 / 230W | |
| $349 – Ryzen 7 7700X | 87.13% | 91.55% | Zen 4 | 8 /16 | 4.5 / 5.4 | 105 / 142W | |
| $329 – Ryzen 7 7700 | 86.19% | 88.88% | Zen 4 | 8 / 16 | 3.8 / 5.3 | 65 / 88W | |
| $429 – Ryzen 9 7900 | 84.75% | 88.46% | Zen 4 | 12 / 24 | 4.7 / 5.6 | 170 / 230W | |
| $249 – Ryzen 5 7600X | 83.62% | 88.44% | Zen 4 | 6 / 12 | 4.7 / 5.3 | 105 / 142W | |
| $229 – Ryzen 5 7600 | 79.74% | 85.97% | Zen 4 | 6 / 12 | 3.8 / 5.1 | 65 / 88W | |
| $550 – Ryzen 9 5950X | 72.04% | 77.51% | Zen 3 | 16 / 32 | 3.4 / 4.9 | 105W | |
| $350 – Ryzen 9 5900X | 71.69% | 78.95% | Zen 3 | 12 / 24 | 3.7 / 4.8 | 105W | |
| $235 – Ryzen 7 5800X | 70.90% | 78.19% | Zen 3 | 8 / 16 | 3.8 / 4.7 | 105W | |
| $210 – Ryzen 7 5700X | 69.50% | 76.65% | Zen 3 | 8 / 16 | 3.4 / 4.6 | 65W | |
| $165 – Ryzen 5 5600X | 67.52% | 74.68% | Zen 3 | 6 / 12 | 3.7 / 4.6 | 65W | |
| $189 – Core i5-12400 | 66.62% | 73.53% | Alder Lake | 6 / 12 (6+0) | 2.5 / 4.4 | 65 / 117W |